Google Ads Quality Score Breakdown: Pay Less Per Click, Get Better Positions

You’re bidding $5 per click on a keyword. Your competitor is bidding $3. But they’re getting the top ad position and you’re stuck in third place. How? The answer is Quality Score — Google’s 1-10 rating of your ad relevance and landing page experience. A higher Quality Score means you pay less per click and get better ad positions. A lower one means you’re overpaying for every click.
Despite being one of the most important metrics in Google Ads, Quality Score is widely misunderstood. Most advertisers know it exists but don’t know how it’s calculated, which components matter most, or how to systematically improve it. That changes today.
In this guide, I’ll break down exactly how Quality Score works, what each component means, and the specific actions you can take to improve each one. No vague advice — just the mechanics and fixes that actually move the needle.
What is Quality Score and why it matters
Quality Score is Google’s estimate of how relevant your ads, keywords, and landing pages are to someone seeing your ad. It’s rated on a scale of 1-10, with 10 being the best. But Quality Score isn’t just a diagnostic number — it directly affects two things that determine your advertising ROI.
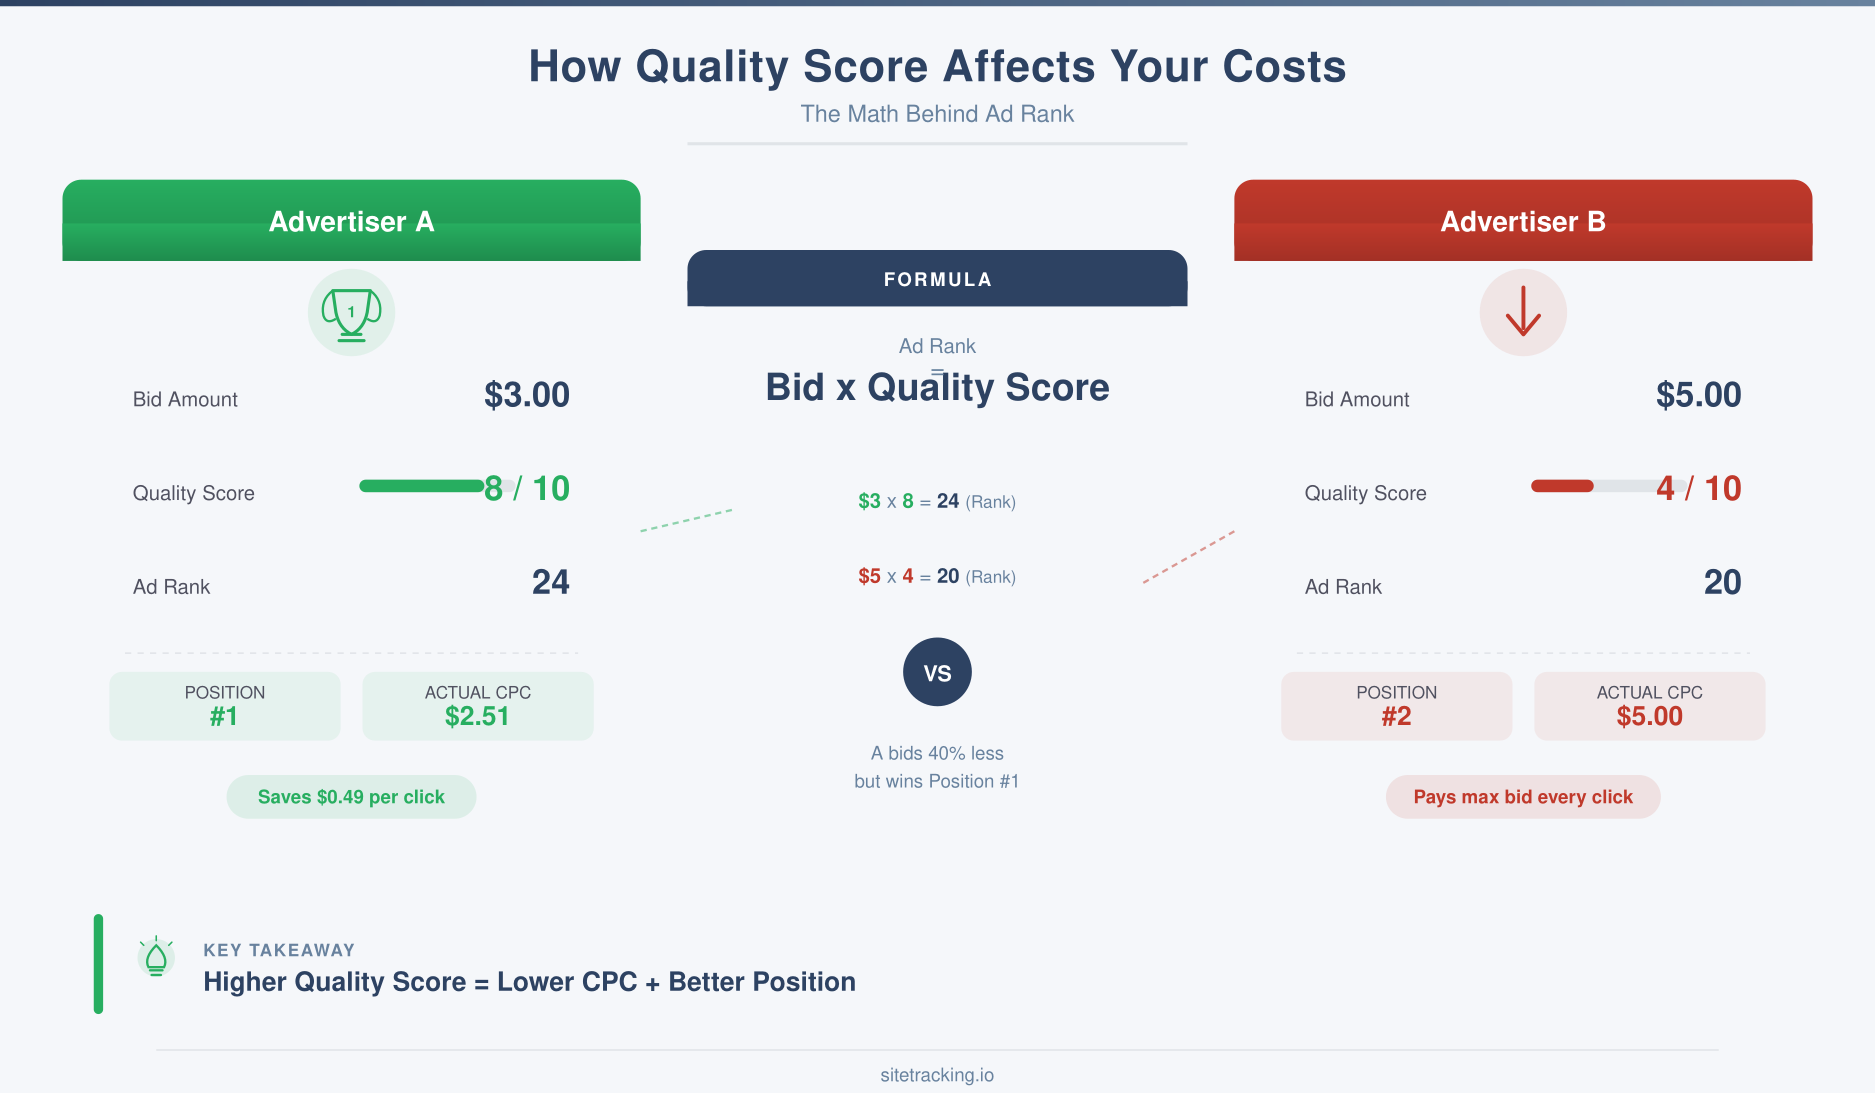
It determines your Ad Rank
Your Ad Rank = your bid × your Quality Score (simplified). This means a $3 bid with a Quality Score of 8 (Ad Rank: 24) beats a $5 bid with a Quality Score of 4 (Ad Rank: 20). The advertiser paying less gets the better position. Over thousands of clicks, this difference compounds into a massive cost advantage.
It determines your actual CPC
Google uses a second-price auction modified by Quality Score. Your actual cost per click is calculated as: (Ad Rank of the advertiser below you / your Quality Score) + $0.01. So the higher your Quality Score, the less you pay for each click — even at the same position. Advertisers with Quality Scores of 8-10 typically pay 30-50% less per click than those with scores of 4-5.
The three components of Quality Score
Google calculates Quality Score from three components. Each one is rated as “Above Average,” “Average,” or “Below Average.” Understanding what drives each component is the key to improving your score.
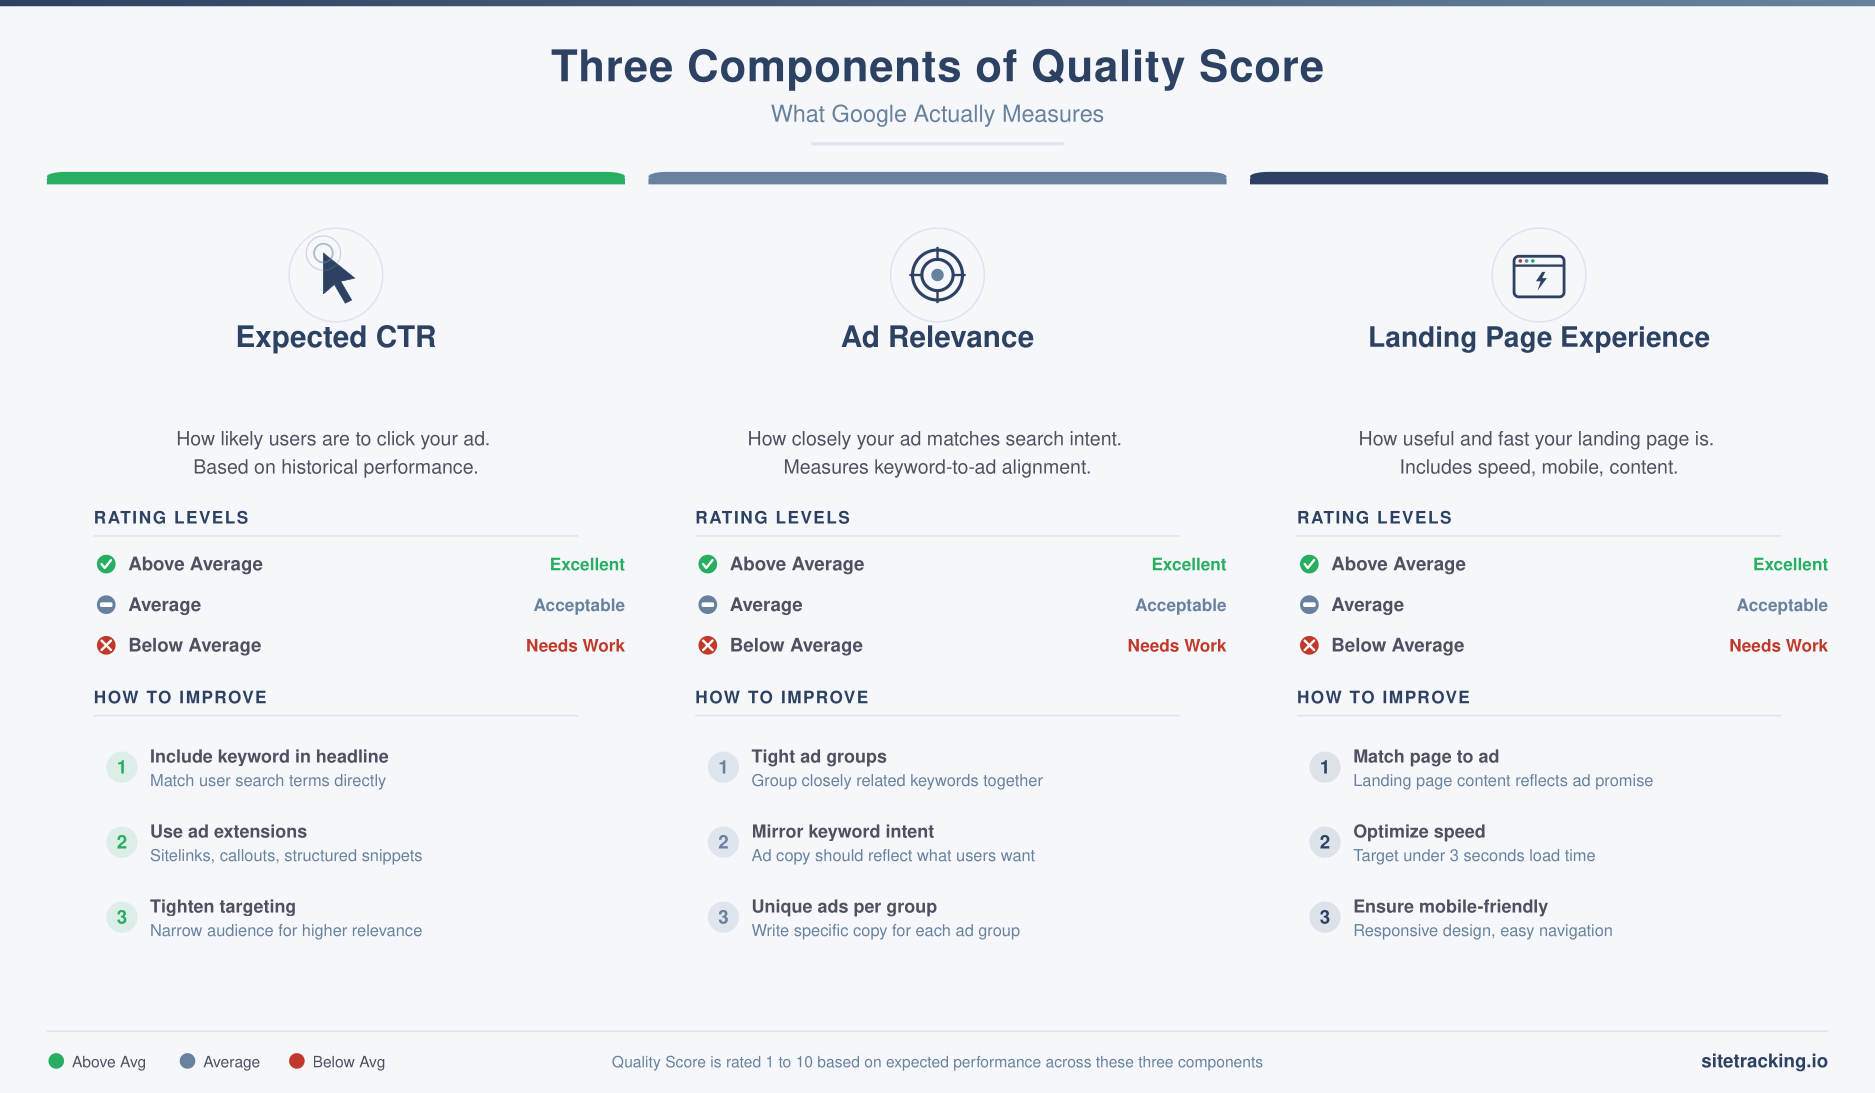
1. Expected Click-Through Rate (CTR)
This is Google’s prediction of how likely someone is to click your ad when it’s shown for that keyword. It’s based on historical click performance, adjusted for ad position. A high expected CTR tells Google your ad is relevant and appealing to users searching for that term.
Expected CTR is typically the most impactful component. An “Above Average” rating here can compensate for weaker performance in the other two areas. Conversely, a “Below Average” CTR is the hardest Quality Score problem to overcome.
2. Ad Relevance
Ad Relevance measures how closely your ad copy matches the intent behind the search query. If someone searches “project management software pricing” and your ad headline says “Best Project Management Tools — See Plans & Pricing,” that’s high relevance. If your ad says “Business Software Solutions,” that’s low relevance — even if you sell project management software.
This component is the easiest to control. It’s largely about having tightly themed ad groups where your ad copy directly addresses the keywords in that group.
3. Landing Page Experience
This measures how useful and relevant your landing page is to someone who clicks your ad. Google evaluates page load speed, mobile-friendliness, content relevance to the ad and keyword, and overall user experience. A landing page that closely matches the ad’s promise and provides a good experience scores well here.
Landing page experience is where your Core Web Vitals directly impact your advertising costs. Slow pages, layout shifts, and poor interactivity don’t just hurt organic rankings — they lower your Quality Score and raise your CPC.
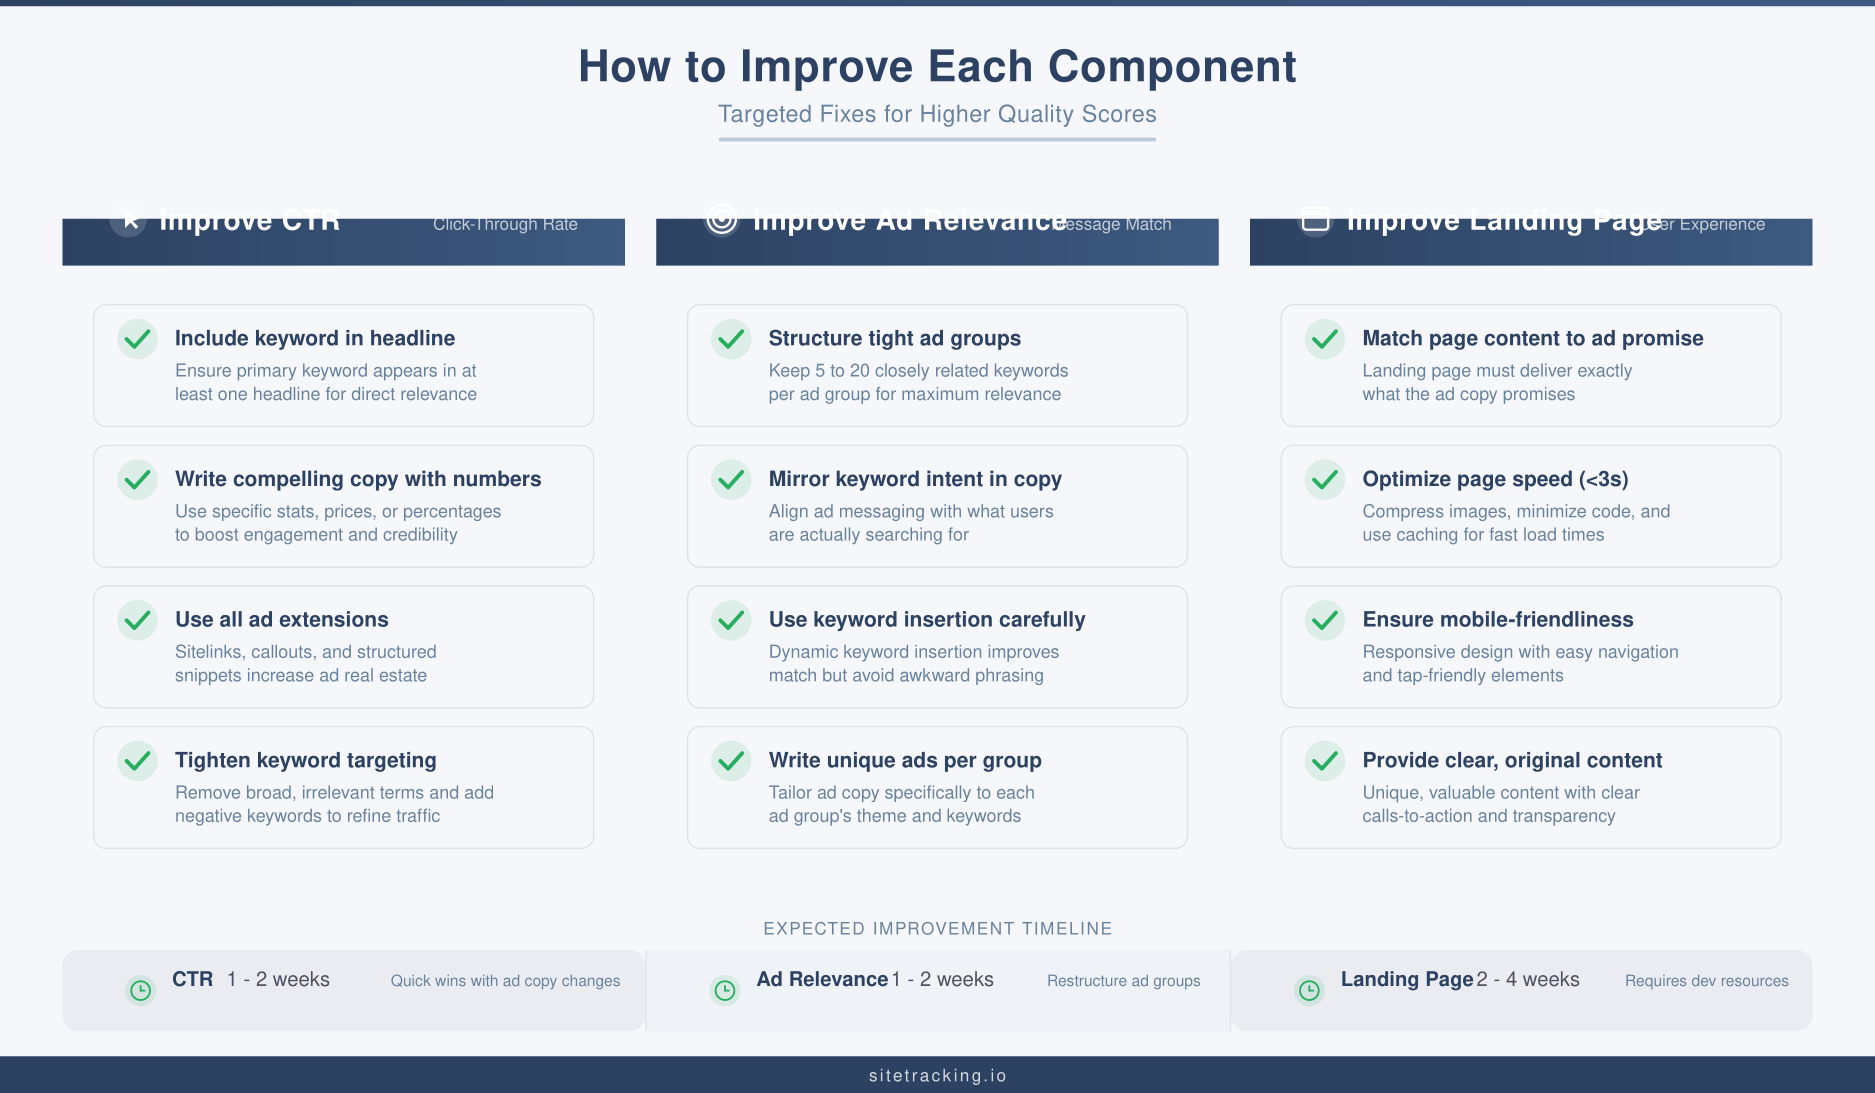
How to improve each Quality Score component
Here are specific, actionable fixes for each component. Start with whichever shows “Below Average” in your Google Ads dashboard.
Improving Expected CTR
- Include the keyword in your headline. Headlines containing the exact search keyword consistently achieve higher CTR. Use responsive search ads with multiple headline variations that include your target keyword and close variations.
- Write compelling ad copy. Include specific numbers (“Save 40%”), urgency (“Limited Time”), or unique value propositions (“No Long-Term Contract”). Ads with specific claims outperform generic benefit statements.
- Use all available ad extensions. Sitelinks, callouts, structured snippets, and other extensions increase your ad’s real estate and provide more reasons to click. Ads with extensions typically see 10-15% higher CTR.
- Tighten your keyword targeting. Broad match keywords often trigger ads for irrelevant searches, driving down CTR. Review search terms regularly and use phrase or exact match for high-value keywords. Add negative keywords aggressively.
Improving Ad Relevance
- Structure ad groups tightly. Each ad group should contain 5-20 closely related keywords. If you have keywords that need different ad messaging, split them into separate ad groups. The tighter the theme, the more relevant your ads can be.
- Mirror keyword intent in ad copy. If the keyword is “buy running shoes online,” your ad should mention buying, running shoes, and online availability. Match both the topic and the intent (informational, commercial, transactional).
- Use keyword insertion carefully. Dynamic keyword insertion can improve relevance for ad groups with similar keywords, but it creates awkward ads when keywords are too varied. Use it only in tightly themed ad groups.
- Write unique ads per ad group. Don’t copy the same ad across multiple ad groups. Each ad group’s ads should be customized for that group’s specific keywords and intent.
Improving Landing Page Experience
- Match landing page content to the ad. If your ad promises “free trial,” the landing page should prominently feature the free trial signup — not a generic homepage. Every ad group should ideally point to a dedicated landing page that directly addresses the keyword’s intent.
- Optimize page speed. Pages that load in under 3 seconds perform significantly better. Compress images, minimize JavaScript, use a CDN. Check your Core Web Vitals scores regularly.
- Ensure mobile-friendliness. Over 60% of Google searches happen on mobile. Your landing page must work flawlessly on phones — large buttons, readable text, no horizontal scrolling, fast load times.
- Provide clear, original content. Google wants landing pages that genuinely help users. Include relevant information, clear navigation, and transparent business practices. Avoid thin content, excessive ads, or misleading claims.
- Track landing page conversions properly. Set up conversion tracking on every landing page. This data doesn’t directly affect Quality Score, but it helps you identify which pages perform best and deserve more budget.
Quality Score by the numbers
Understanding the financial impact of Quality Score helps you prioritize improvements.
- Quality Score 10: You pay approximately 50% less than the average CPC for that keyword.
- Quality Score 7: You pay roughly the average CPC — this is your baseline target.
- Quality Score 5: You pay about 25% more than average.
- Quality Score 3: You pay about 67% more than average.
- Quality Score 1: You pay up to 400% more than average — essentially, Google is penalizing you for poor relevance.
For an account spending $10,000/month with an average Quality Score of 5, improving to a Quality Score of 7 could save roughly $2,500/month — or $30,000/year. That’s the same as getting 25% more clicks for free.
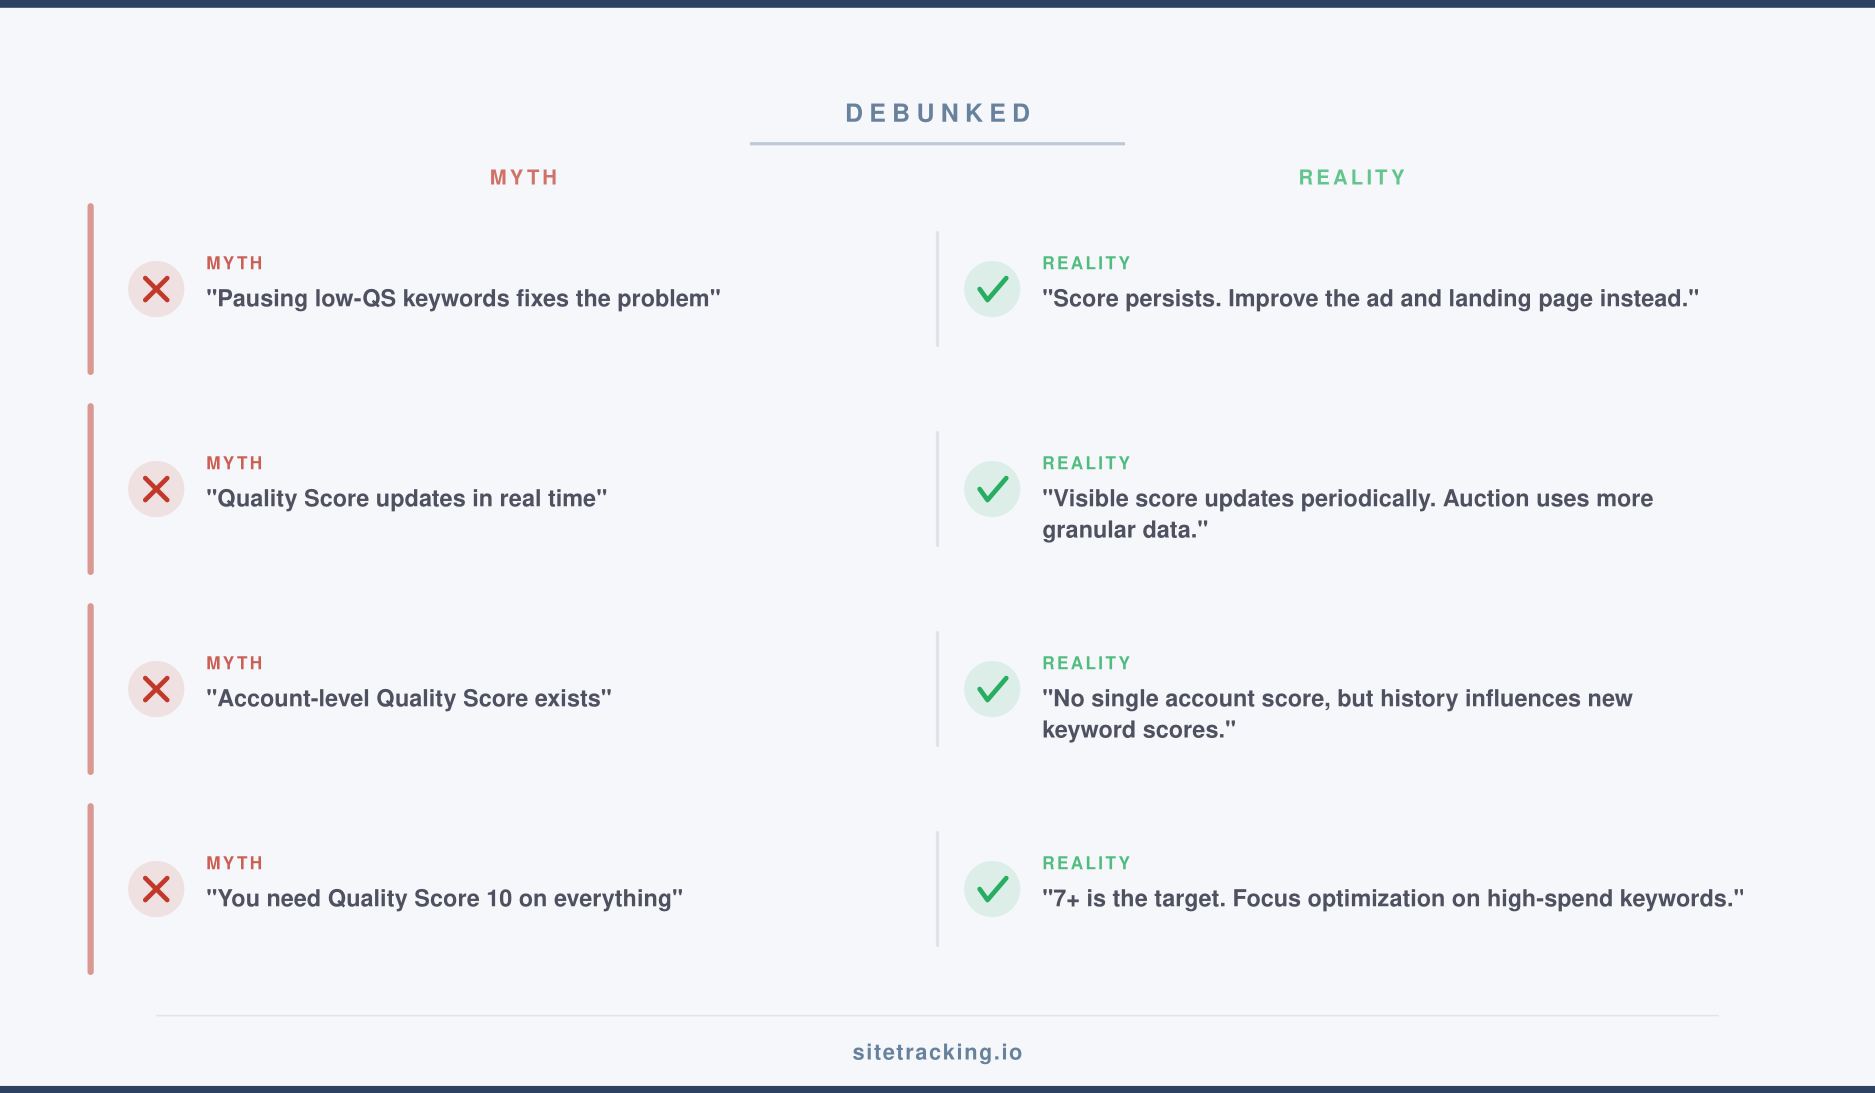
Common Quality Score myths
- “Pausing low-QS keywords fixes the problem.” Pausing doesn’t reset Quality Score. When you reactivate the keyword, it keeps its historical score. Instead, improve the ad and landing page, then let the score recover over time.
- “Quality Score is updated in real time.” The visible Quality Score in your dashboard updates periodically, not with every auction. Google uses a real-time calculation in the actual auction that’s more granular than the 1-10 number you see.
- “Account-level Quality Score exists.” Google has stated there’s no single account-level Quality Score. However, historical account performance can influence new keywords’ initial scores. A well-managed account with consistently high Quality Scores tends to see better initial scores for new keywords.
- “You need a Quality Score of 10 on everything.” A Quality Score of 7+ is good for most keywords. Chasing 10s on every keyword has diminishing returns. Focus your optimization effort on high-spend keywords where a Quality Score improvement has the biggest dollar impact.
A practical Quality Score improvement workflow
Here’s the process I use to systematically improve Quality Score across an account.
- Step 1: Export and prioritize. Export your keyword data with Quality Score, component ratings, spend, and conversions. Sort by spend descending. Focus on high-spend keywords with Quality Scores below 7 first — these represent the biggest savings opportunity.
- Step 2: Diagnose the component. For each low-QS keyword, check which component is “Below Average.” This tells you exactly where to focus. Don’t guess — let the data direct your effort.
- Step 3: Apply targeted fixes. Use the component-specific improvements above. If CTR is below average, rewrite ads. If ad relevance is below average, restructure ad groups. If landing page experience is below average, optimize the page.
- Step 4: Monitor and iterate. Quality Score changes take 1-4 weeks to reflect improvements. Check weekly and track the trend. Use UTM parameters to track which landing page versions drive better engagement alongside your Quality Score monitoring.
Frequently Asked Questions
How long does it take to improve Quality Score?
Most changes take 1-4 weeks to reflect in your visible Quality Score. Ad copy changes that improve CTR tend to show results fastest (1-2 weeks). Landing page improvements may take longer (2-4 weeks) because Google needs to re-crawl and re-evaluate your page.
Does Quality Score affect display and video campaigns?
Quality Score as a visible metric only applies to Search campaigns. However, Google uses similar relevance signals in Display and Video campaign auctions. The principles of relevance, landing page quality, and expected engagement apply across all campaign types.
Should I delete and recreate low Quality Score keywords?
No. Deleting and recreating a keyword doesn’t reset its Quality Score — Google associates performance history with the keyword-ad group combination. Instead, improve the ad and landing page. If the keyword is genuinely irrelevant to your business, remove it permanently and focus on keywords you can legitimately rank well for.
Key takeaways
- Quality Score directly affects your CPC and ad position. Higher scores mean lower costs and better placement — improving from 5 to 7 can save 25% on ad spend.
- Three components drive Quality Score: Expected CTR (most impactful), Ad Relevance (easiest to fix), and Landing Page Experience (biggest long-term investment).
- Diagnose before fixing — check which component is “Below Average” and apply targeted improvements rather than making random changes.
- Prioritize by spend — improve Quality Score on your highest-spend keywords first for maximum cost savings.
- Quality Score of 7 is the target for most keywords. Chasing 10s everywhere has diminishing returns.
- Core Web Vitals and landing page quality affect both organic rankings and paid advertising costs — optimizing once benefits both channels.
Quality Score isn’t a mysterious black box. It’s a measurable, improvable metric with clear components and known fixes. The advertisers who win in Google Ads aren’t always the ones with the biggest budgets — they’re the ones who systematically optimize relevance at every level. Start with your highest-spend, lowest-score keywords, diagnose the specific component that needs work, and apply the targeted fixes in this guide. The cost savings compound over time, giving you a permanent structural advantage over less disciplined competitors.