Channel Mix Optimization: A Data-Driven Framework for Budget Allocation
You’re spending $50,000 a month across Google Ads, Meta, LinkedIn, email, and SEO. Your CFO asks a reasonable question: “If we had $10,000 more to spend, where would it go?” And you can’t answer with confidence. You know each channel’s ROAS in isolation, but you don’t know how they interact, which ones are hitting diminishing returns, and where the next dollar would generate the most incremental revenue.
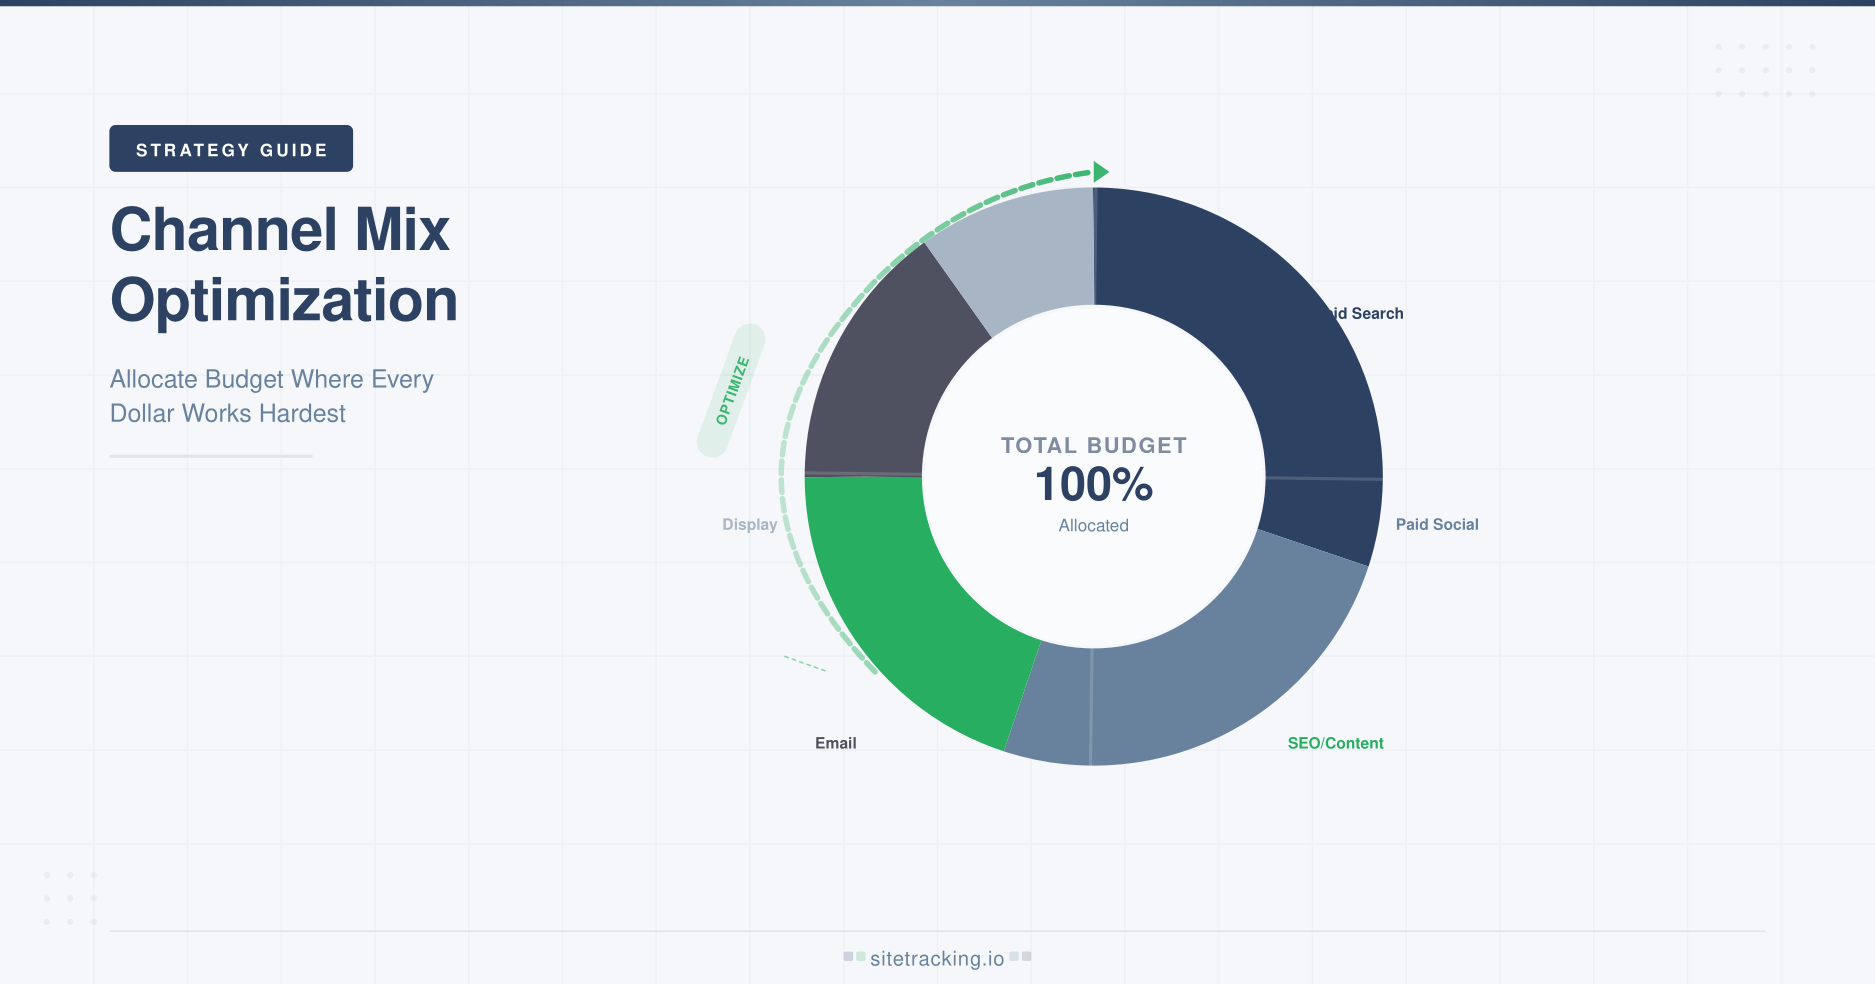
This is the channel mix optimization problem — and it’s one of the most valuable challenges in marketing strategy. Getting your channel mix right isn’t about finding the single best channel. It’s about finding the optimal allocation across all channels simultaneously, accounting for how they influence each other and where each one sits on its return curve.
In this guide, I’ll walk you through a practical framework for optimizing your marketing channel mix. You’ll learn how to evaluate channel performance beyond simple ROAS, identify diminishing returns, account for cross-channel effects, and build a data-driven budget allocation model. No advanced statistics required — just structured thinking and the data you already have.
Why simple ROAS comparison doesn’t work
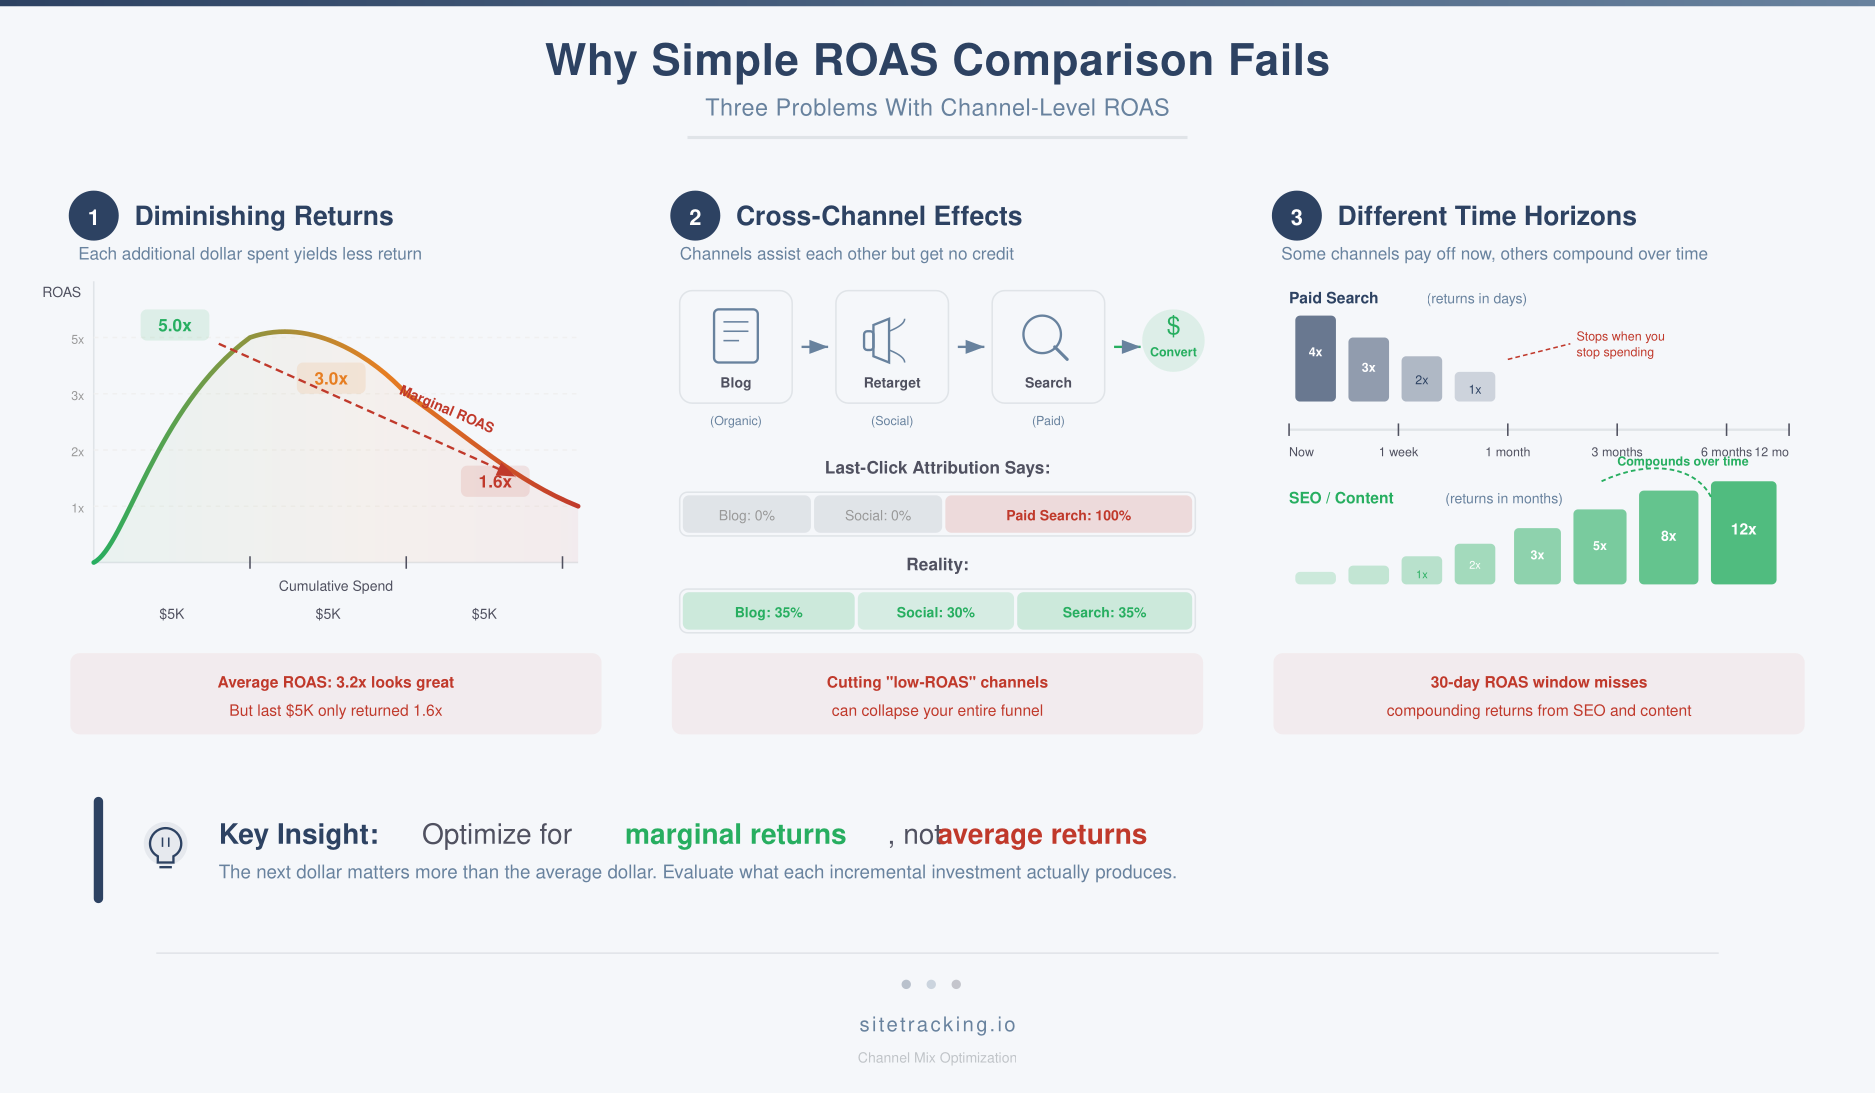
The most common approach to channel allocation is comparing ROAS across channels and shifting budget to whichever has the highest return. It sounds logical, but it fails for three reasons.
Diminishing returns
Every channel has a saturation point. Your first $5,000 in Google Ads might generate $25,000 in revenue (5x ROAS). But the next $5,000 might only generate $15,000 (3x ROAS). And the next $5,000 after that might generate just $8,000 (1.6x ROAS). The average ROAS across the full $15,000 looks healthy, but the marginal ROAS on the last dollar is approaching break-even. Allocating more budget based on average ROAS ignores this reality.
Cross-channel effects
Channels don’t operate independently. A user might discover you through a blog post (organic), see a retargeting ad (paid social), click a branded search ad (paid search), and then convert. Each channel played a role, but your attribution model probably gives most or all the credit to one of them. Cutting the “low-performing” channels based on last-click data can crater the ones that appear to be performing well.
Different time horizons
SEO and content marketing generate returns over months and years. Paid search generates returns immediately. Comparing their ROAS on a monthly basis unfairly penalizes long-term channels and over-rewards short-term ones. A proper channel mix accounts for the time value of each channel’s contribution.
A framework for channel mix optimization
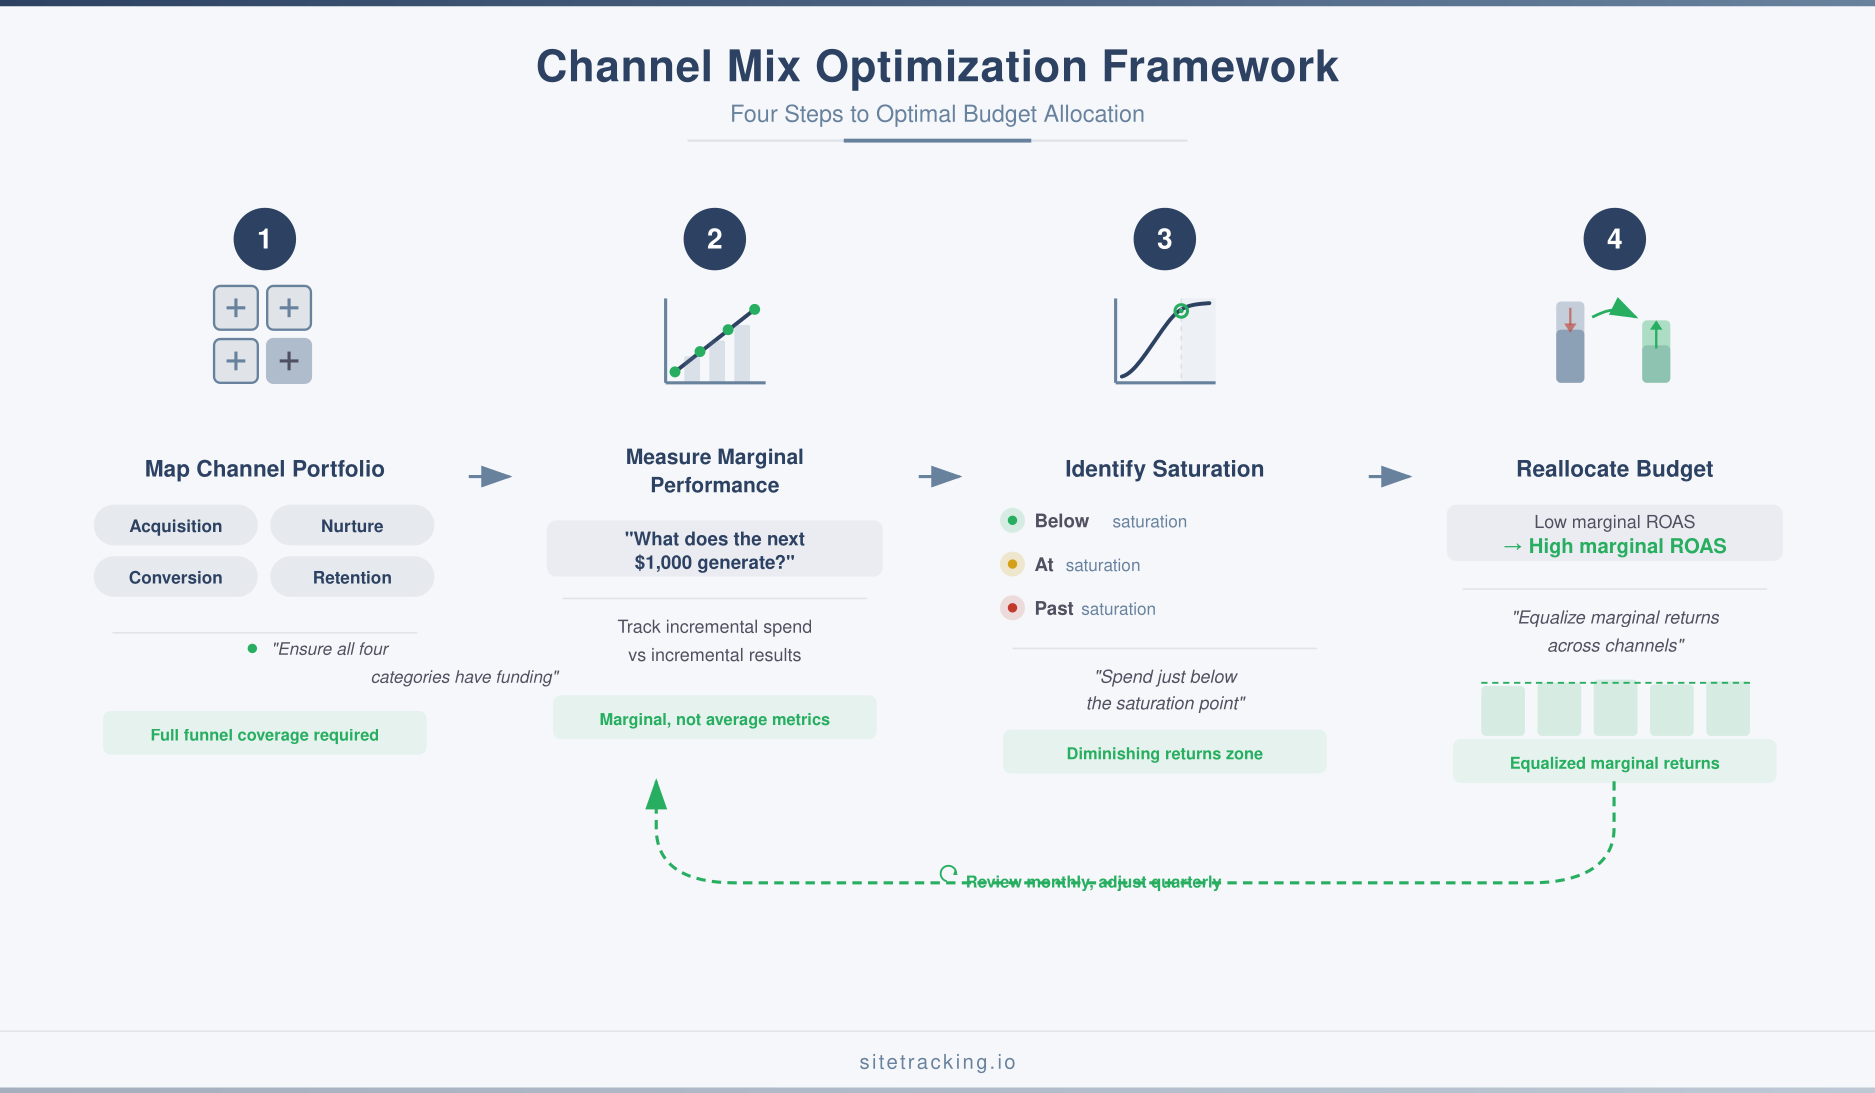
Here’s the four-step framework I use to build and optimize channel mix allocations. It works for budgets from $10,000 to $1,000,000 per month.
Step 1: Map your channel portfolio
Start by listing every marketing channel you’re currently using and categorizing them by function.
- Acquisition channels bring new users to your site for the first time. These include paid search (non-brand), paid social prospecting, display advertising, and organic search for informational queries.
- Nurture channels deepen engagement with known users. Email marketing, content marketing, organic social, and retargeting campaigns fall here.
- Conversion channels capture demand at the moment of purchase intent. Branded search, shopping ads, and direct response email are typical conversion channels.
- Retention channels keep existing customers engaged and drive repeat purchases. Customer email, loyalty programs, and remarketing to past buyers serve this function.
A healthy channel mix includes channels from all four categories. Over-investing in conversion channels without funding acquisition channels creates a shrinking funnel — you’ll capture more of today’s demand but generate less future demand.
Step 2: Measure marginal performance
For each channel, estimate the marginal return — not the average return. The question isn’t “what’s our ROAS?” but “what would happen if we spent $1,000 more (or less) in this channel?”
The simplest approach: look at your spending history. If you’ve varied your spend in a channel over time, compare the incremental spend to the incremental results. When you increased Google Ads from $20K to $25K last month, how much incremental revenue did that $5K generate? That’s your marginal ROAS.
For more precision, run controlled incrementality tests. Pause spending in a geographic region or time period and measure the impact. This is the gold standard for understanding true channel contribution — though it requires enough scale to get statistically meaningful results.
Track everything with consistent UTM parameters so your analytics accurately reflects each channel’s contribution. And use micro-conversions as leading indicators for channels where final conversion data is sparse.
Step 3: Identify the saturation curve
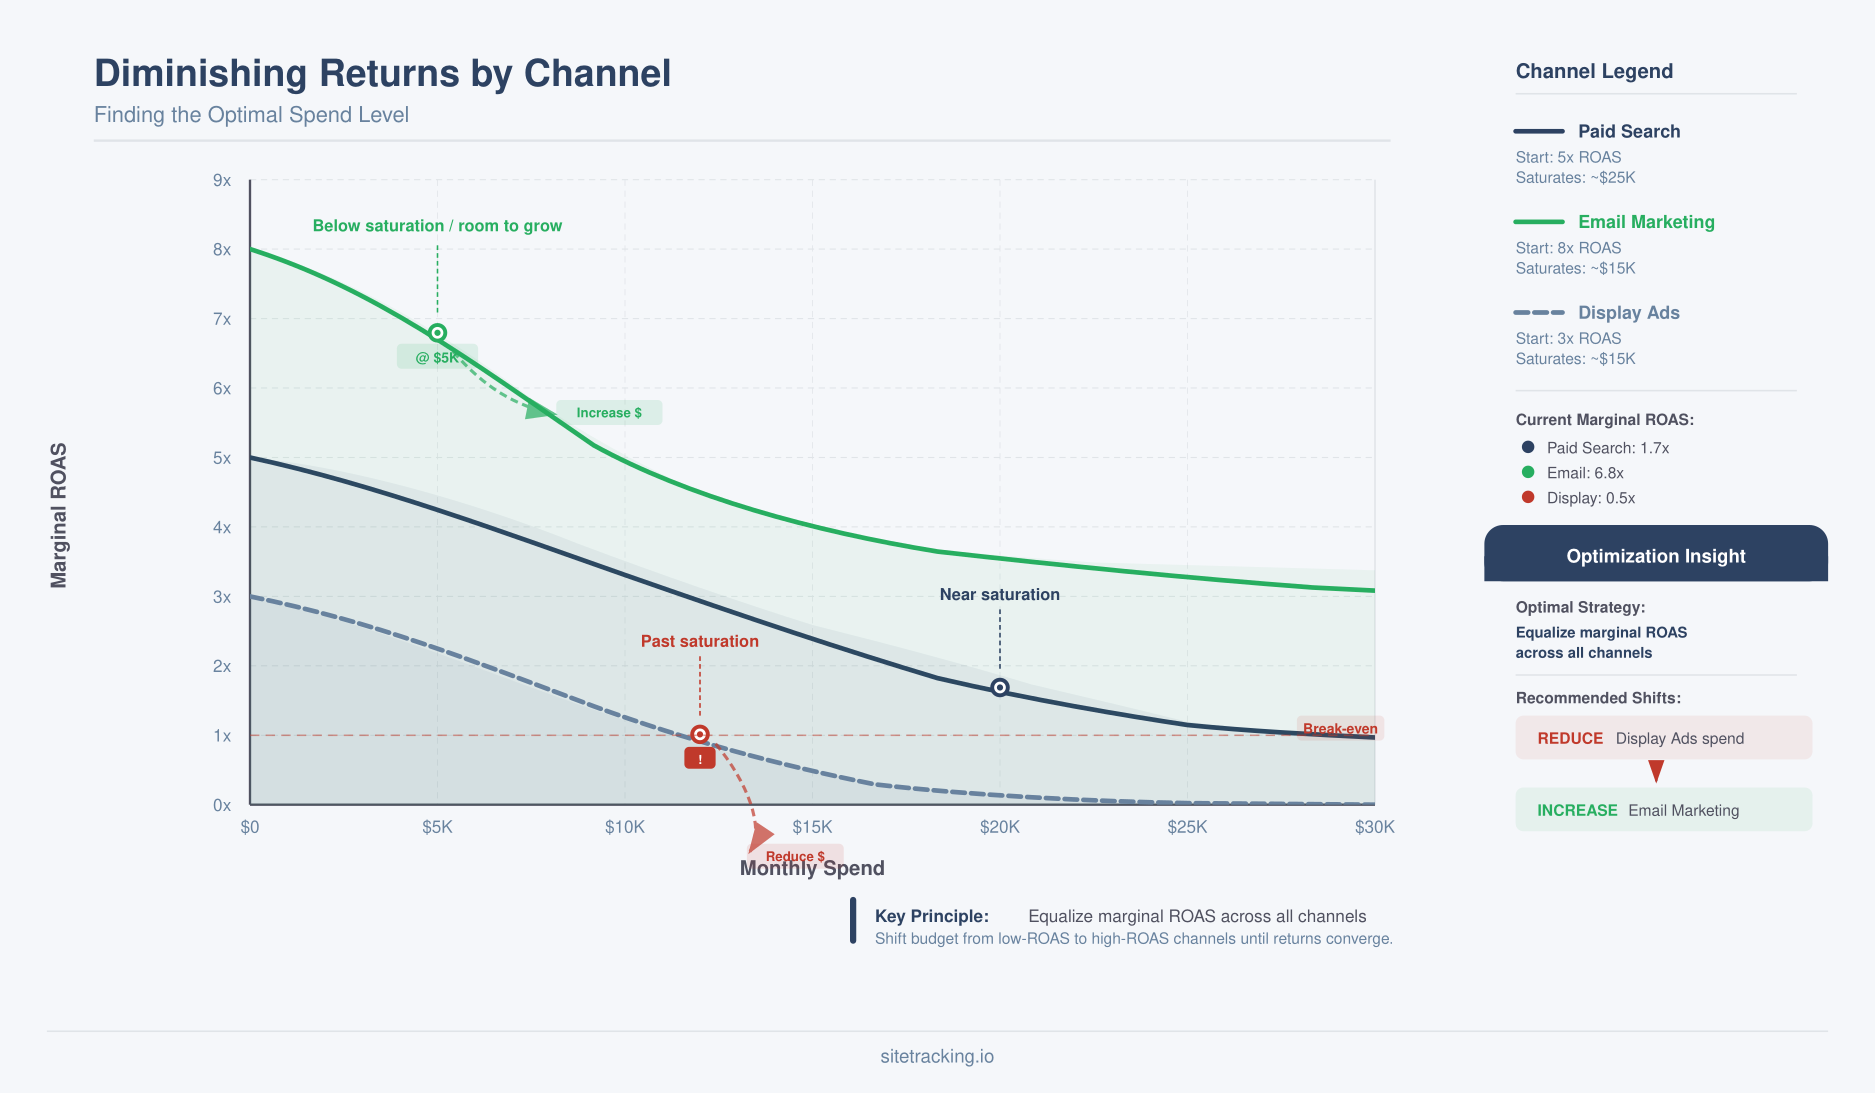
Plot your spending and marginal returns for each channel over the last 6-12 months. You’ll typically see one of three patterns:
- Below saturation: Marginal returns are stable or increasing. This channel can absorb more budget efficiently. Increase spend here.
- At saturation: Marginal returns are declining but still positive. This channel is near its optimal spend level. Maintain current budget.
- Past saturation: Marginal returns are near break-even or negative. Every additional dollar here earns less than it costs. Reduce spend and reallocate.
The optimal channel mix puts each channel just below its saturation point — spending enough to capture most of the available returns without wasting budget on diminishing returns.
Step 4: Reallocate based on marginal efficiency
Here’s the core optimization principle: shift budget from channels with low marginal returns to channels with high marginal returns. Keep reallocating until marginal returns are roughly equal across all channels. At that point, no further reallocation can improve total returns — you’ve found your optimal mix.
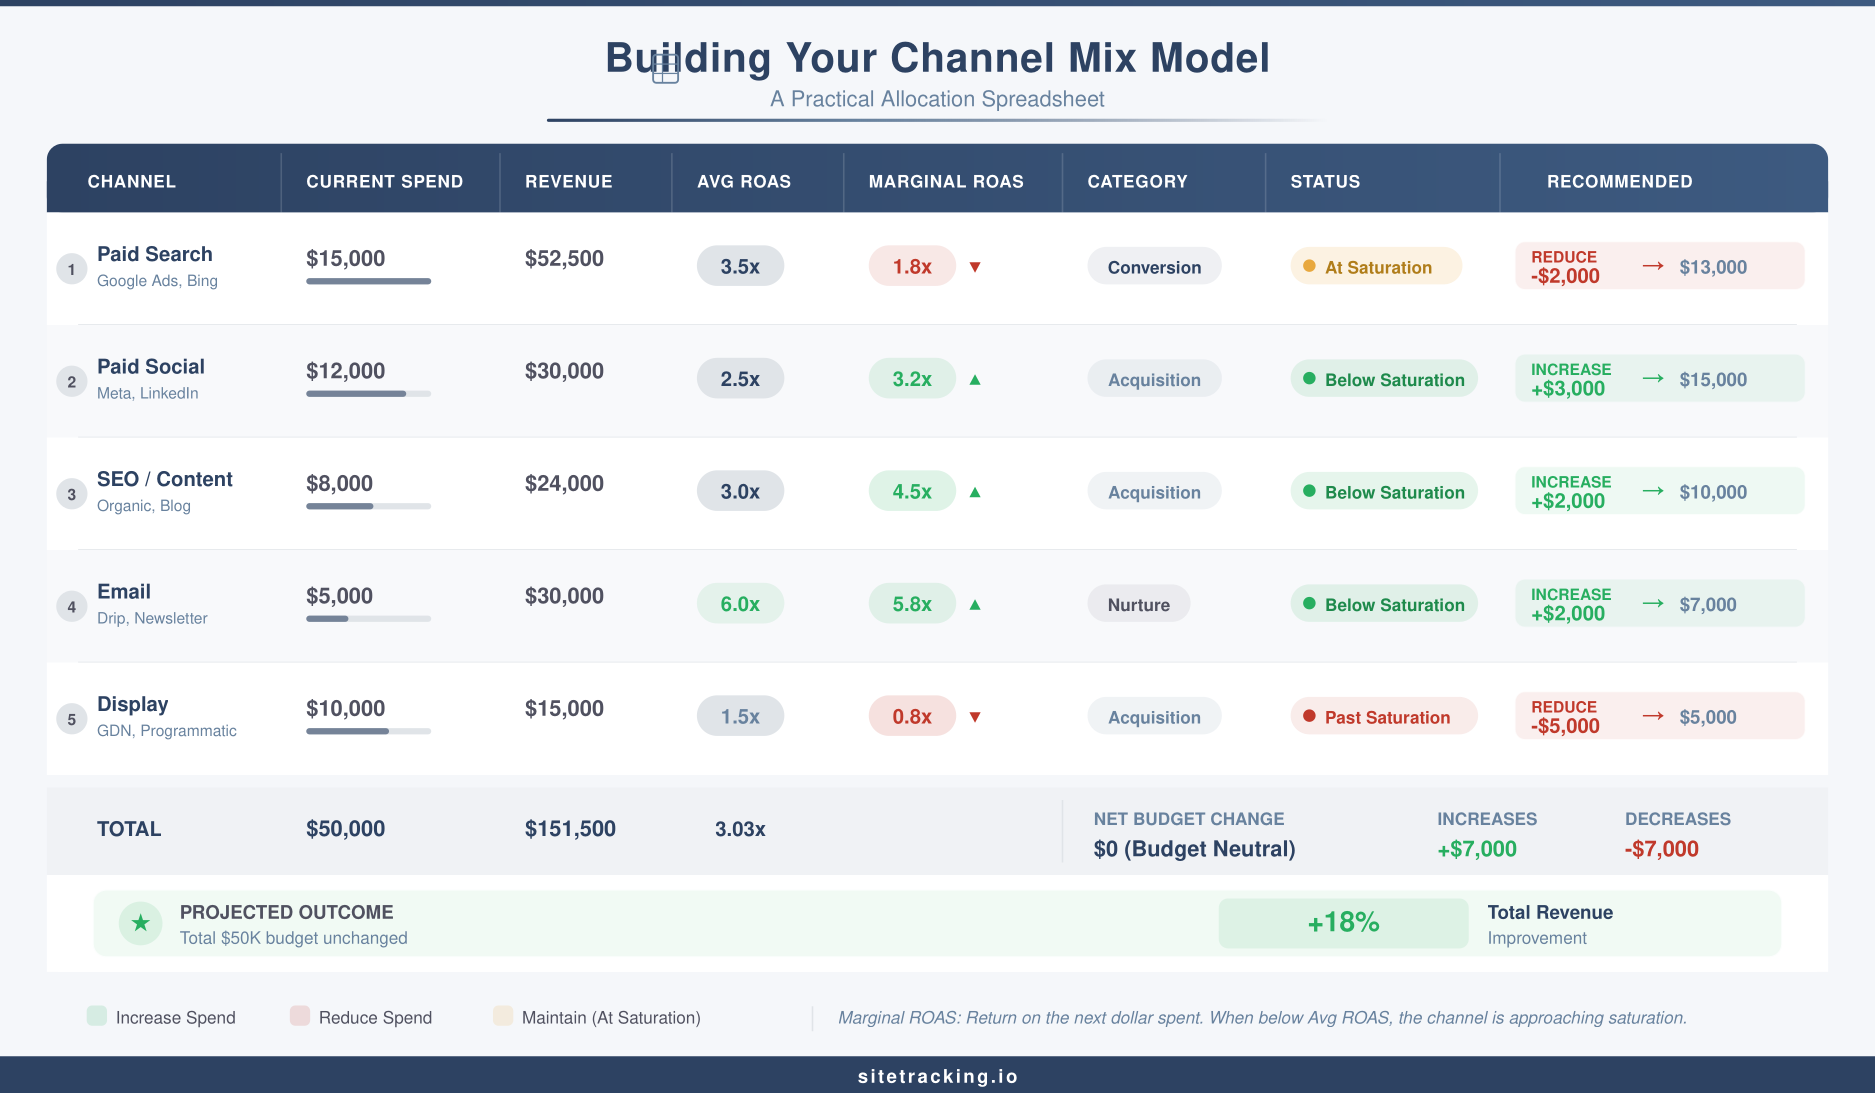
In practice, this means taking $2,000 from Google Ads (where marginal ROAS has dropped to 2x) and putting it into email marketing (where marginal ROAS is 6x), even though Google Ads has a higher average ROAS. The average is irrelevant — what matters is where the next dollar works hardest.
Accounting for cross-channel interactions
The framework above treats channels independently, but in reality they interact. Here’s how to account for the most important interactions.
- Map the assist path. In GA4’s Conversion Paths report, look at which channels commonly appear before a converting channel. If organic search frequently assists paid search conversions, cutting organic investment will likely hurt paid search performance — even though organic’s direct conversion numbers look weak.
- Test channel interactions. When you reduce spend in one channel, monitor not just that channel’s performance but all channels. If cutting display spending causes branded search volume to drop, you’ve found a dependency. Document these relationships.
- Use multi-touch attribution as a directional guide. While no attribution model is perfect, comparing last-click and data-driven models shows you which channels are under- or over-valued. Channels that look much better in data-driven attribution are likely important assist channels.
- Budget for content and SEO as infrastructure. Content and organic search often function as infrastructure that makes other channels more effective. Your internal linking strategy drives organic traffic that feeds retargeting audiences. Blog content gives email marketing something to send. These channels may not show strong direct ROAS but removing them degrades the whole system.
Building your channel mix model
You don’t need expensive marketing mix modeling software to start optimizing your channel mix. A spreadsheet model works well for most organizations. Here’s how to build one.
- Columns: Channel name, current monthly spend, current revenue attributed, current ROAS, estimated marginal ROAS, channel category (acquisition/nurture/conversion/retention), saturation status, recommended budget change.
- Input data: Pull 6-12 months of spend and revenue data per channel. Calculate marginal ROAS by comparing months with different spend levels.
- Optimization logic: Sort channels by marginal ROAS. Shift 5-10% of budget from the lowest marginal ROAS channels to the highest. Ensure each channel category retains minimum viable investment.
- Constraints: Set minimum and maximum spend for each channel. Don’t zero out any channel without testing first. Keep at least 15-20% of budget in acquisition channels to maintain pipeline health.
- Review cadence: Update the model monthly with actual results. Make allocation changes quarterly — not more frequently, to allow changes to show their impact before re-optimizing.
Align your channel mix model with your measurement maturity level. At Level 2, use simple ROAS comparisons with manual adjustments. At Level 3, incorporate multi-touch attribution. At Level 4+, build automated models that recommend reallocations based on real-time marginal performance.
Frequently Asked Questions
How often should I change my channel mix?
Review monthly, adjust quarterly. Frequent changes don’t allow enough time to measure impact and create noisy data. Seasonal businesses may need faster adjustments around peak periods, but the core allocation should be stable enough to generate meaningful performance data.
What if I can’t measure marginal ROAS for all channels?
Start with the channels where you have good data (typically paid channels) and use incrementality tests for harder-to-measure channels. For organic search and content, use leading indicators like traffic growth, keyword rankings, and engagement metrics as proxies until you can run proper lift tests.
Should I ever cut a channel entirely?
Rarely. Before cutting a channel, test by reducing spend 50% and monitoring the impact on all other channels for 4-6 weeks. If there’s no negative spillover, you can consider cutting further. But many channels that look weak on direct attribution are actually supporting other channels — you won’t know until you test.
Key takeaways
- Simple ROAS comparison leads to bad allocation because it ignores diminishing returns, cross-channel effects, and different time horizons.
- Optimize for marginal returns, not average returns. Shift budget from channels with low marginal ROAS to channels with high marginal ROAS.
- Map your channel portfolio across acquisition, nurture, conversion, and retention functions. Ensure each category has adequate funding.
- Identify saturation points for each channel. Spend just below saturation for maximum efficiency.
- Account for cross-channel effects — channels that assist conversions have hidden value that direct attribution misses.
- Review monthly, reallocate quarterly. Build a simple spreadsheet model and improve it over time as your measurement maturity grows.
Channel mix optimization is where marketing strategy and data come together. It’s not about finding a magic formula — it’s about building a disciplined process for allocating budget based on evidence rather than habit. Start with the framework in this guide, build your first allocation model, and commit to reviewing it regularly. Every quarter you optimize, your marketing budget works a little harder. Over a year, the compounding effect of better allocation outperforms any single channel tactic you could implement.