Core Web Vitals Optimization: Step-by-Step Fixes for LCP, INP, and CLS
Your site looks great. Content is solid. But PageSpeed Insights is showing a red score, and your pages take four seconds to become interactive. Meanwhile, your competitor’s near-identical site loads in under two seconds and ranks above you.
The difference? Core Web Vitals. Google uses these three performance metrics as a ranking signal, and they directly affect user experience. A slow site doesn’t just frustrate visitors — it pushes you down in search results.
In this guide, I’ll walk you through each Core Web Vital metric, explain exactly what causes poor scores, and give you step-by-step fixes. No vague advice like “optimize your images” — specific technical solutions you can implement today. If you’re also working on internal linking and broader SEO strategy, performance optimization is the technical foundation that makes everything else work better.
What are Core Web Vitals?
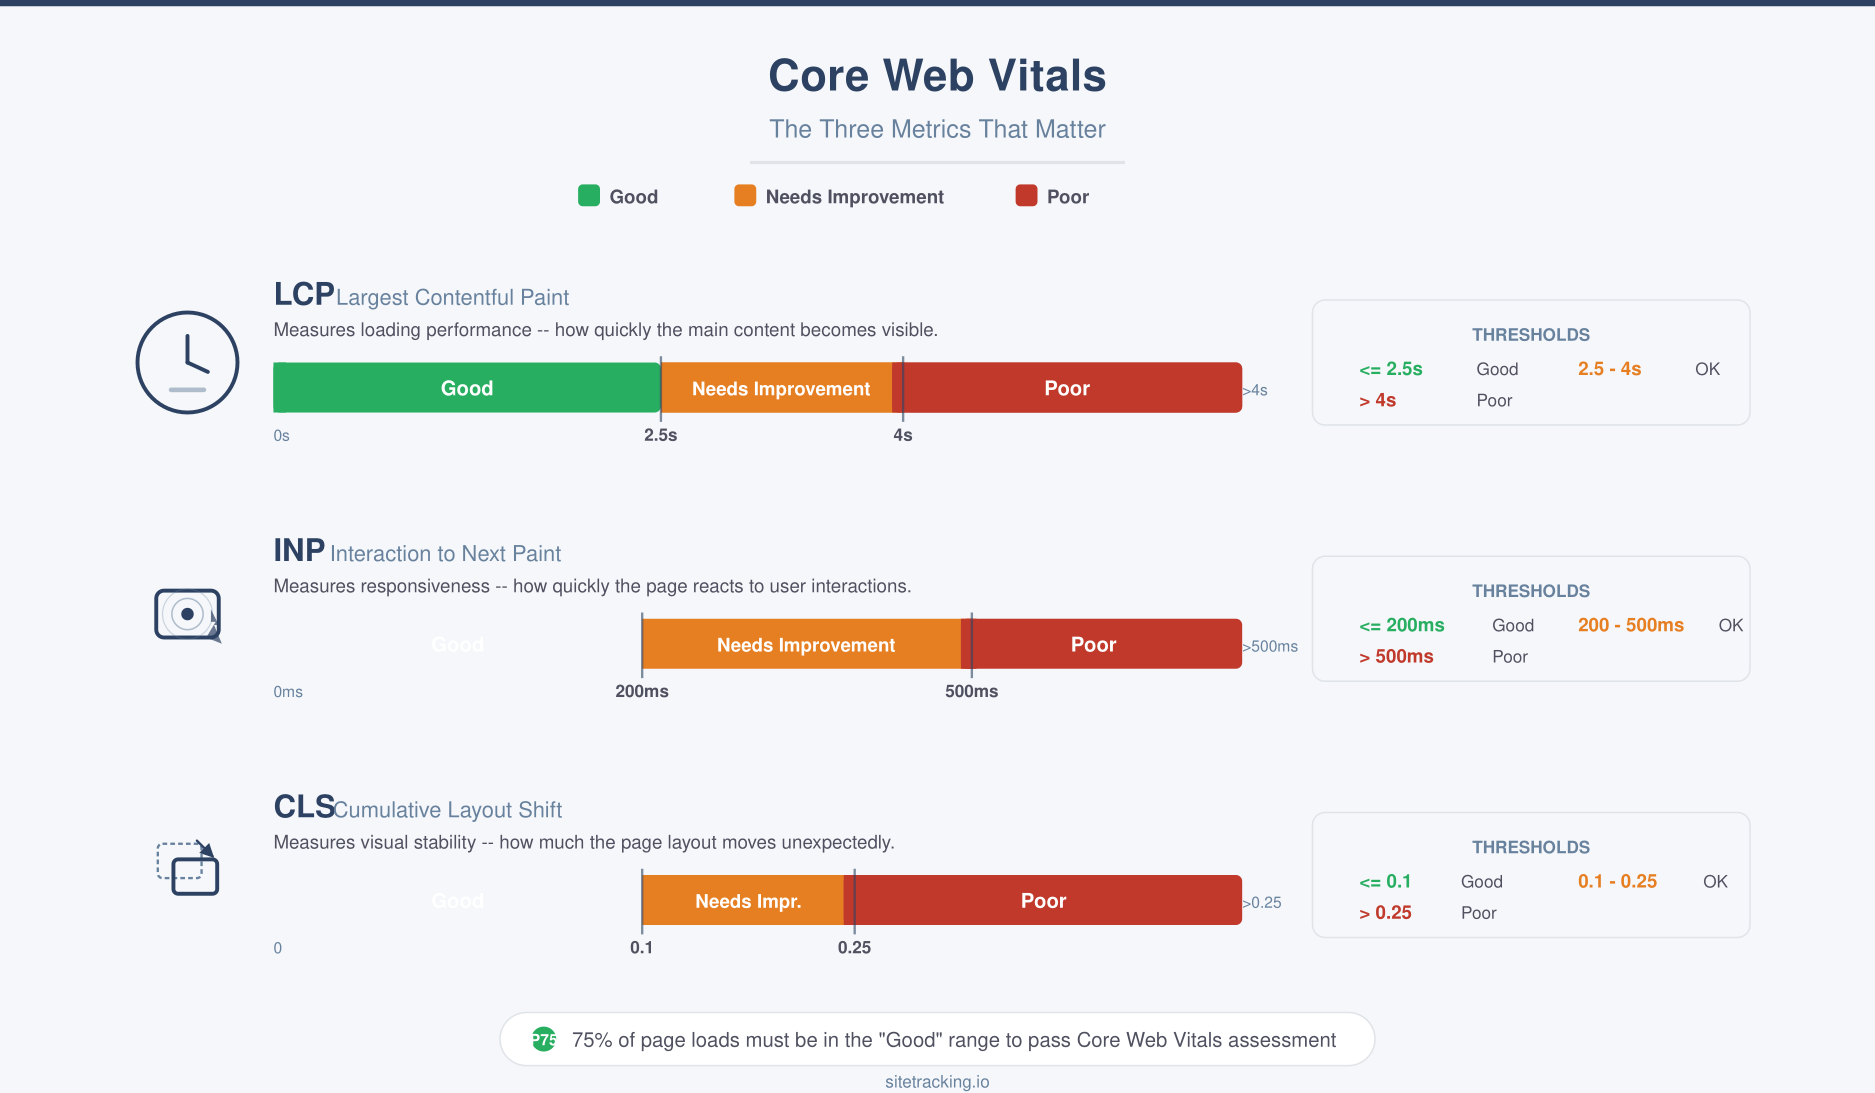
Core Web Vitals are three specific metrics that Google uses to measure real-world user experience on your website. They focus on loading speed, interactivity, and visual stability. Together, they answer the question: does this page feel fast and responsive to actual users?
Here’s what each metric measures:
| Metric | Measures | Good | Needs Improvement | Poor |
|---|---|---|---|---|
| LCP (Largest Contentful Paint) | Loading speed | ≤ 2.5s | 2.5s – 4.0s | > 4.0s |
| INP (Interaction to Next Paint) | Interactivity | ≤ 200ms | 200ms – 500ms | > 500ms |
| CLS (Cumulative Layout Shift) | Visual stability | ≤ 0.1 | 0.1 – 0.25 | > 0.25 |
Google measures these metrics using real user data from the Chrome User Experience Report (CrUX). This means your scores reflect actual visitor experiences, not just lab tests. If 75% of your page loads meet the “good” threshold for all three metrics, your page passes Core Web Vitals.
LCP optimization: fixing slow loading
Largest Contentful Paint measures how long it takes for the biggest visible element — usually a hero image, heading, or video thumbnail — to fully render. It’s the metric that most directly reflects “did this page load fast?”
Common LCP problems
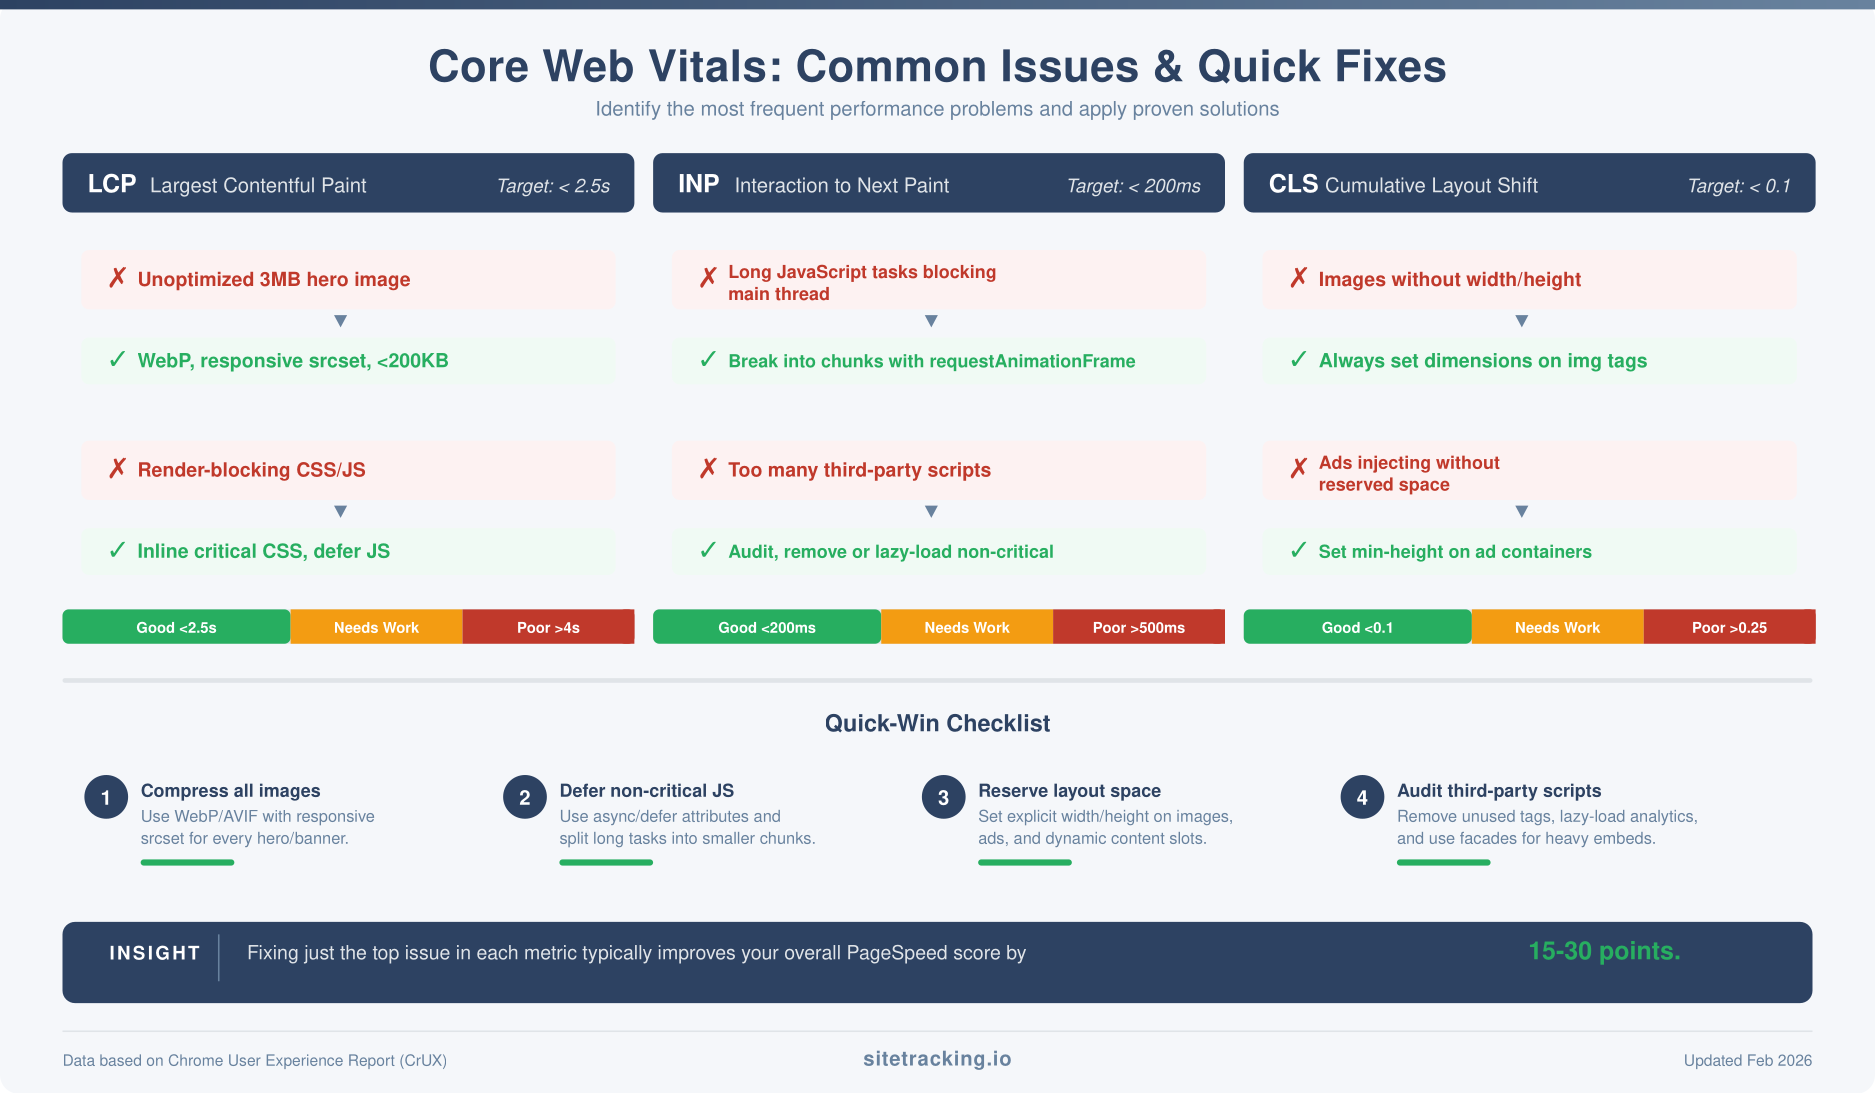
- Unoptimized images. A 3MB hero image is the single most common LCP killer. Large images take time to download, especially on mobile connections.
- Slow server response (TTFB). If your server takes more than 600ms to respond, LCP can’t be good regardless of what else you optimize. This is a hosting or backend issue.
- Render-blocking resources. CSS and JavaScript files in the
<head>that must download before the browser can paint anything. - Client-side rendering. If your page relies on JavaScript to render content, the LCP element doesn’t appear until the JS executes. This adds significant delay.
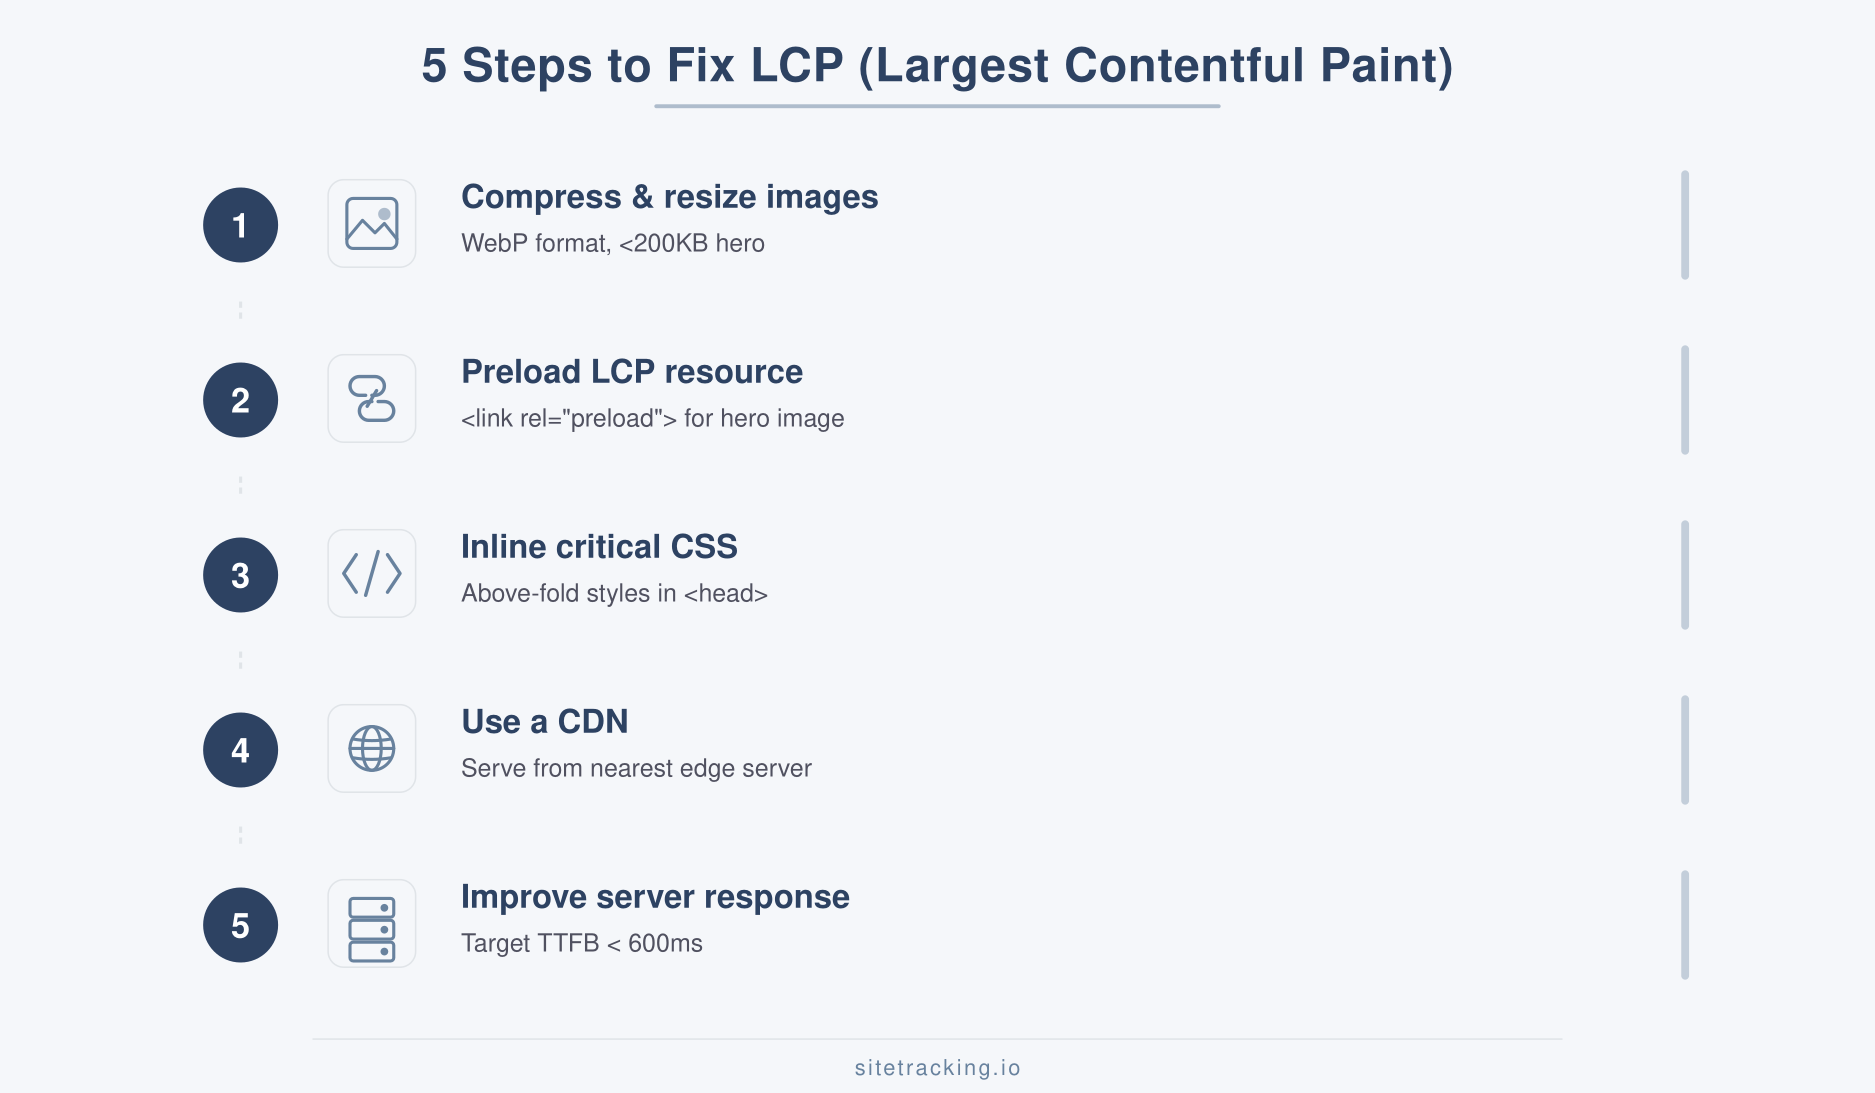
Step-by-step LCP fixes
- Compress and resize images. Convert hero images to WebP format. Target file sizes under 200KB for above-the-fold images. Use responsive images with
srcsetto serve appropriately sized versions for each device. - Preload the LCP resource. Add
<link rel="preload">for your hero image or critical font. This tells the browser to fetch it immediately rather than waiting for CSS to request it. - Inline critical CSS. Extract the CSS needed for above-the-fold content and inline it in the
<head>. Load the rest asynchronously. This eliminates render-blocking stylesheet downloads. - Use a CDN. Content Delivery Networks serve assets from servers close to your visitors. This reduces download time significantly, especially for international audiences.
- Improve server response time. Upgrade hosting if TTFB exceeds 600ms. Enable server-side caching, use HTTP/2, and consider static site generation for content-heavy pages.
INP optimization: fixing slow interactions
Interaction to Next Paint replaced First Input Delay (FID) as a Core Web Vital in March 2024. It measures how quickly your page responds to user interactions — clicks, taps, and key presses. Specifically, INP tracks the delay from when a user interacts to when the browser paints the visual response.
Common INP problems
- Heavy JavaScript execution. Long-running scripts block the main thread. While JS is executing, the browser can’t respond to user input. As a result, clicks and taps feel sluggish or unresponsive.
- Third-party scripts. Analytics tags, chat widgets, ad scripts, and social embeds all compete for main thread time. Each one adds latency to user interactions.
- Excessive DOM size. Pages with thousands of DOM nodes take longer to update. Every interaction that triggers a re-render becomes slower as DOM complexity increases.
- Forced synchronous layouts. JavaScript that reads layout properties (like
offsetHeight) and then writes to the DOM causes the browser to recalculate layout multiple times — a pattern called layout thrashing.
Step-by-step INP fixes
- Break up long tasks. Use
requestAnimationFrameorsetTimeoutto split heavy computations into smaller chunks. This yields the main thread back to the browser between chunks, allowing it to process user input. - Defer non-critical JavaScript. Add
deferorasyncattributes to script tags. Move analytics and tracking scripts lower in the page or load them after the page becomes interactive. - Audit third-party scripts. Use Chrome DevTools Performance tab to identify which scripts consume the most main thread time. Remove or lazy-load scripts that aren’t critical for initial interaction.
- Reduce DOM size. Target fewer than 1,500 DOM nodes. Use virtualization for long lists. Remove hidden elements that aren’t needed until user action triggers them.
- Use
requestIdleCallbackfor non-urgent work. Schedule analytics initialization, prefetching, and other background tasks during idle periods rather than during page load.
CLS optimization: fixing layout shifts
Cumulative Layout Shift measures how much your page content moves unexpectedly while loading. You know the experience — you’re about to tap a link and suddenly the page shifts because an ad loaded above it. That’s a layout shift, and it’s one of the most frustrating user experiences on the web.
Common CLS problems
- Images without dimensions. If you don’t specify
widthandheightattributes on<img>tags, the browser doesn’t know how much space to reserve. When the image loads, everything below it shifts. - Ads and embeds. Third-party content that loads after the initial page render pushes content down. Ad slots are the most common culprit.
- Web fonts causing FOIT/FOUT. When custom fonts load, text can shift between the fallback font and the web font. This is especially noticeable when the fonts have different physical dimensions.
- Dynamically injected content. Banners, cookie notices, and notification bars that insert themselves into the page layout after load cause shifts.
Step-by-step CLS fixes
- Always set image dimensions. Add
widthandheightattributes to every<img>and<video>element. Modern browsers use these to calculate aspect ratio and reserve space before the asset loads. - Reserve space for ads. Use CSS
min-heighton ad containers to prevent layout shifts when ads load. If an ad slot is 250px tall, setmin-height: 250pxon its container. - Use
font-display: swapwith matched fallbacks. This shows text immediately in a fallback font, then swaps to the web font when loaded. Use tools like font fallback matching to minimize the visual difference between fallback and web fonts. - Overlay instead of inject. For cookie notices and banners, use fixed positioning or overlays rather than inserting content into the document flow. This prevents layout shifts entirely.
- Avoid inserting content above the fold. If you must add dynamic content, add it below the current viewport or use CSS
containto limit its layout impact.
How to measure Core Web Vitals
Use these tools to diagnose and monitor your performance. Each serves a different purpose.
- PageSpeed Insights — Shows both lab data (simulated) and field data (real users). Start here for a quick overview. The field data section shows your actual CrUX scores.
- Google Search Console — The Core Web Vitals report groups all your pages by status (Good, Needs Improvement, Poor). Use this for site-wide monitoring and to identify which page templates have issues.
- Chrome DevTools Performance tab — For deep technical analysis. Record a page load or interaction, and inspect the timeline to find exactly which resources or scripts cause bottlenecks.
- Web Vitals JavaScript library — Add real-user monitoring to your site. Send CWV data to your analytics tool to track performance over time and segment by device, connection speed, or page type.
For tracking how performance changes affect your conversion rates, combine CWV monitoring with proper conversion tracking. Understanding how UTM parameters attribute traffic sources also helps you isolate which campaigns drive visitors to your fastest (or slowest) pages. Faster pages typically convert better — but you need data from both sides to prove it.
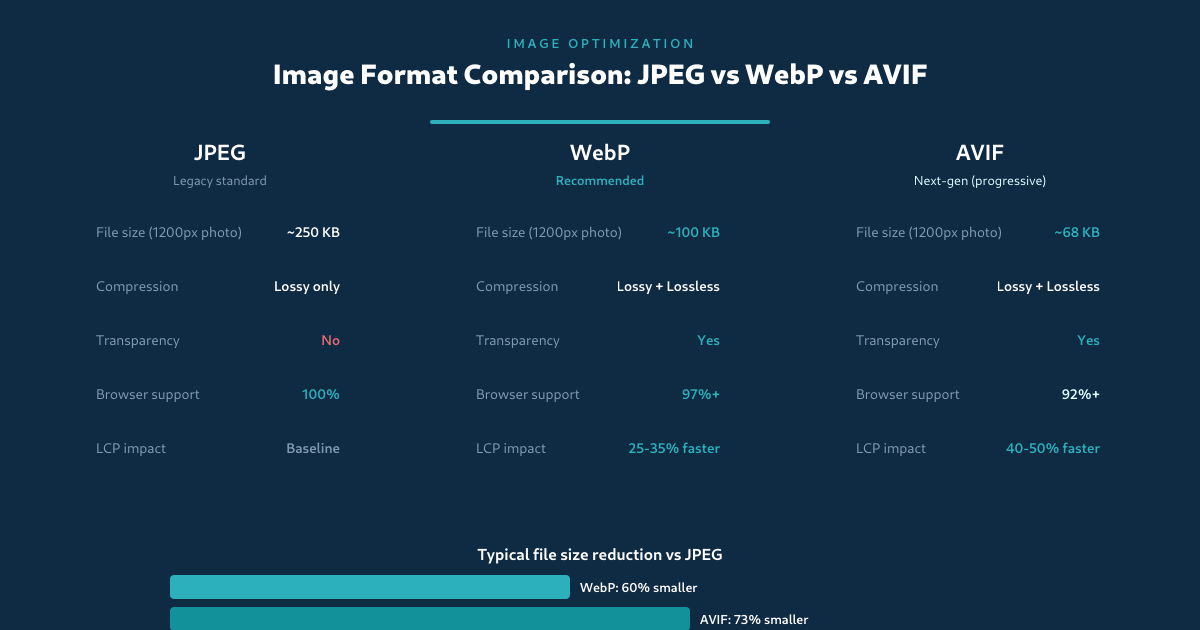
Image format comparison: WebP vs AVIF vs JPEG
Image optimization is the single biggest lever for improving LCP. But “optimize your images” is vague advice. Let’s get specific about formats — because the format you choose matters as much as the compression level.
JPEG is the legacy standard. It’s universally supported, but its compression technology is decades old. A typical 1200px hero image weighs around 250KB in JPEG — and that’s already optimized.
WebP (developed by Google) delivers the same visual quality at 60% smaller file sizes. That 250KB JPEG becomes ~100KB. Browser support is 97%+ in 2026, making it safe for production use. WordPress 5.8+ generates WebP versions automatically when you upload images — you just need to enable it.
AVIF takes it further — 73% smaller than JPEG at comparable quality. The tradeoff: encoding is slower (matters for build pipelines, not users) and browser support is at 92%+. If your audience skews toward modern browsers, AVIF is the best option available today.
The practical approach: use the <picture> element to serve AVIF with WebP fallback and JPEG as the last resort. Most WordPress image optimization plugins (ShortPixel, Imagify, EWWW) handle this automatically.
Lazy loading and resource hints
Two powerful techniques that control when and how resources load — and they work in opposite directions.
Lazy loading: defer what’s below the fold
Lazy loading delays image and iframe downloads until they’re about to enter the viewport. This reduces initial page weight and frees bandwidth for the LCP element. Modern browsers support native lazy loading with the loading="lazy" attribute — no JavaScript required.
Critical rule: never lazy-load your LCP element. The hero image or above-the-fold content should load immediately. WordPress adds loading="lazy" to all images by default since version 5.5, but it also skips the first image in the content. Verify this works correctly on your theme — some themes override this behavior.
Resource hints: preload what matters
Resource hints tell the browser to start fetching critical resources before it discovers them naturally. There are four types, each serving a different purpose:
| Hint | What it does | When to use |
|---|---|---|
preload | Fetches a resource immediately with high priority | Hero images, critical fonts, above-the-fold CSS |
preconnect | Establishes connection to a third-party origin early | CDN domains, Google Fonts, analytics endpoints |
dns-prefetch | Resolves DNS for a third-party domain | All external domains you’ll request later |
prefetch | Fetches a resource for the next navigation (low priority) | Resources for likely next page visits |
The combination of lazy loading (for below-fold content) and preloading (for critical content) gives you precise control over your loading waterfall. This is especially impactful for LCP — preloading the hero image alone can shave 200-500ms off LCP in many cases.
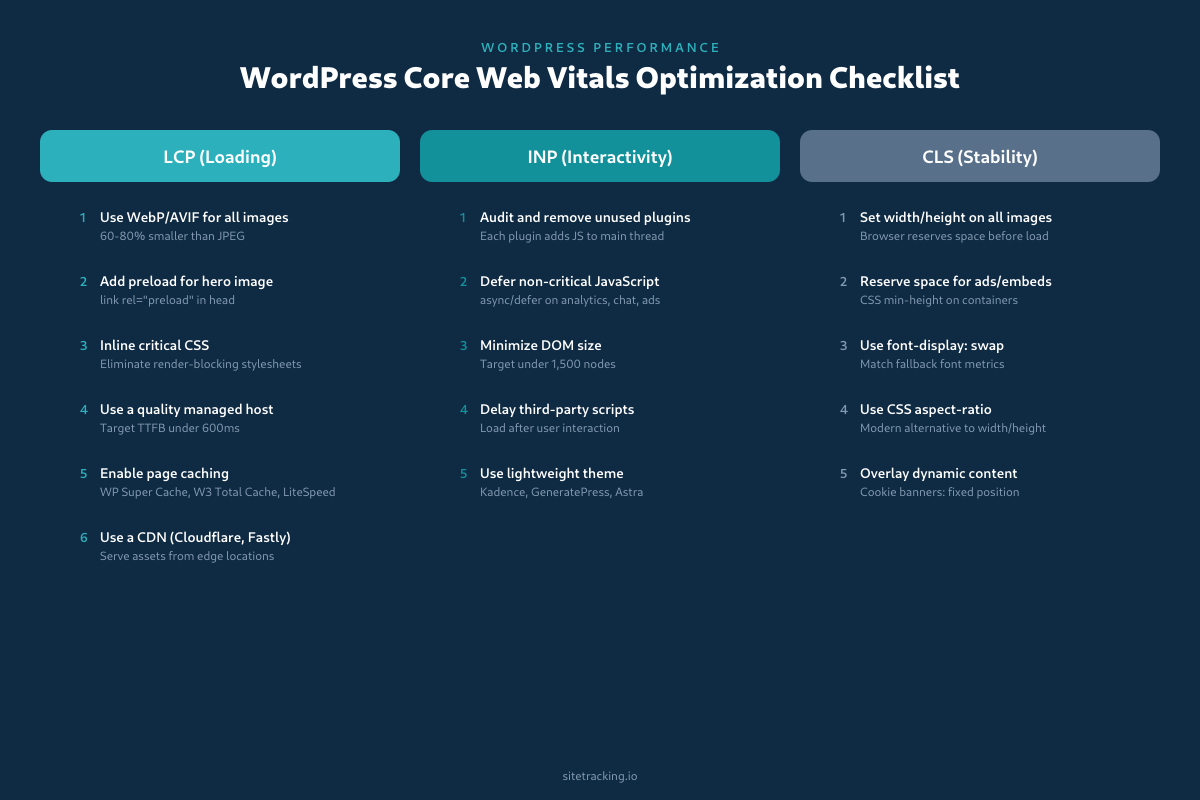
Core Web Vitals for WordPress sites
WordPress powers 43% of the web, and its ecosystem creates unique CWV challenges. Themes load global CSS for every block type. Plugins inject JavaScript on every page. Page builders add layers of wrapper elements. Here’s how to address WordPress-specific performance issues.
Theme and plugin optimization
- Choose a performance-focused theme. Kadence, GeneratePress, and Astra are built for speed. Avoid themes that load jQuery UI, multiple slider libraries, or custom frameworks. The theme is the foundation — a bloated theme makes everything else harder.
- Audit your plugins quarterly. Every active plugin adds PHP execution time (TTFB), JavaScript (INP), and often CSS (render-blocking). Use the Query Monitor plugin to see exactly which plugins add which assets on each page. Deactivate anything you’re not actively using.
- Conditionally load plugin assets. Many plugins load their CSS and JS on every page even when they’re only needed on one. Use Asset CleanUp or Perfmatters to disable plugin assets on pages where they aren’t needed. For example, your contact form plugin’s scripts shouldn’t load on blog posts.
- Use block-based patterns instead of page builders. Gutenberg’s native blocks render cleaner HTML with fewer DOM nodes than Elementor or WPBakery. If your LCP or INP scores are poor, excessive page builder markup could be a contributing factor.
Caching and hosting
- Enable page caching. Without caching, every WordPress page request executes PHP and queries MySQL. With page caching, the server returns a static HTML file — TTFB drops from 800ms+ to under 200ms. Use WP Super Cache, W3 Total Cache, or your host’s built-in caching (Cloudways, Kinsta, and WP Engine all include this).
- Enable object caching. Install Redis or Memcached to cache database query results. This matters most for logged-in users and dynamic pages where page caching doesn’t apply.
- Use a CDN. Cloudflare’s free tier alone can improve LCP by 200-400ms for visitors far from your server. For the best results, enable full HTML caching at the CDN level — not just static assets.
- Choose managed WordPress hosting. Shared hosting is the most common cause of high TTFB. If your time to first byte exceeds 600ms consistently, upgrading hosting is more impactful than any other optimization.
How to read a PageSpeed Insights report
PageSpeed Insights is the go-to diagnostic tool, but many people only look at the score and miss the actionable details. Here’s what to focus on.
Field data vs lab data. The top section shows field data — real user measurements from CrUX. This is what Google uses for ranking. The lab data below is a simulated test from a single location. When they disagree, trust the field data. If your field data says “Good” but lab says “Poor,” your real users are fine.
The performance waterfall. In the Diagnostics section, look at “Avoid chaining critical requests.” This shows the sequence of resources that must load before your LCP element can appear. Every link in the chain adds latency. Your goal: shorten this chain by preloading, inlining, or eliminating dependencies.
Treemap view. Click “View Treemap” to see a visual breakdown of all JavaScript on the page — sized by bytes and colored by unused code coverage. This immediately reveals which scripts are bloated and which aren’t earning their weight. It’s the fastest way to find JavaScript to defer or remove.
Origin summary. At the top of the field data section, toggle between the specific URL and the origin (full domain) view. If your origin scores are good but specific URLs are poor, you have template-specific issues rather than site-wide problems. This helps you prioritize which page templates to optimize first.
Track your PageSpeed improvements alongside conversion data. Better CWV scores should correlate with improved user engagement — use your GA4 event tracking to verify this connection.
Core web vitals optimization priority framework
Not all fixes are equal. Here’s how I prioritize core web vitals optimization work based on impact and effort.
- Fix LCP first. It has the most direct impact on perceived speed and is usually the easiest to improve. Image optimization alone often gets you to “good” threshold.
- Address CLS next. Layout shift fixes are typically straightforward (add dimensions, reserve space) and have an outsized impact on user experience.
- Tackle INP last. Interactivity issues often require JavaScript refactoring, which is more complex. However, INP problems affect user engagement significantly, so don’t skip it.
Focus on your highest-traffic pages first. A 0.5-second LCP improvement on a page with 50,000 monthly visits matters more than perfecting a page with 500 visits. Use Search Console’s CWV report to identify which pages need attention most urgently.
Frequently Asked Questions
How much do Core Web Vitals affect SEO rankings?
Core Web Vitals are a confirmed ranking factor, but they’re one signal among many. Content relevance and authority still matter more. However, in competitive niches where multiple pages have similar content quality, CWV can be the tiebreaker. Moreover, better performance directly improves user engagement metrics like bounce rate and time on site, which indirectly support rankings.
Should I optimize for lab data or field data?
Field data (real users) is what Google uses for ranking. Lab data (Lighthouse) is useful for diagnosing specific issues but doesn’t reflect real-world conditions. Consequently, always prioritize field data scores. Use lab data to identify what to fix, then verify improvements in field data after deploying changes. Note that field data updates take 28 days to reflect changes since CrUX uses a rolling average.
Do Core Web Vitals matter for mobile and desktop separately?
Yes. Google evaluates mobile and desktop CWV scores independently. Since Google primarily uses mobile-first indexing, mobile CWV scores typically matter more for rankings. Always optimize for mobile first, then verify desktop performance separately.
What is a good Core Web Vitals score?
A “good” score means your page meets all three thresholds: LCP under 2.5 seconds, INP under 200 milliseconds, and CLS under 0.1. Google requires that 75% of page loads hit these thresholds — not 100%. So occasional slow loads from users on poor connections won’t fail you. Check your scores in Google Search Console under the Core Web Vitals report, or enter any URL into PageSpeed Insights to see both field and lab results.
How long does it take for CWV improvements to affect rankings?
CrUX field data uses a 28-day rolling average, so Google won’t see your improvements until about a month after deployment. After that, ranking changes depend on how competitive your niche is and how much CWV was holding you back. Sites moving from “Poor” to “Good” typically see measurable changes within 2-3 months. Use UTM-tagged links to track organic traffic changes accurately during this period.
Do Core Web Vitals matter for every page?
Google evaluates CWV at the page level, but patterns across your domain matter too. If most of your site passes CWV but one page template fails, that template’s pages may rank lower. Prioritize fixing your highest-traffic page templates first — the ones that affect the most users and the most potential search traffic.
Can a WordPress site pass Core Web Vitals?
Absolutely. As of early 2026, over 40% of WordPress sites pass all Core Web Vitals in the CrUX dataset. The keys are a lightweight theme (Kadence, GeneratePress, Astra), page caching, image optimization with WebP/AVIF, and disciplined plugin management. WordPress itself is not the problem — plugin bloat and unoptimized themes are. The checklist in the WordPress section of this guide covers everything you need.
Key takeaways
- Core Web Vitals measure three things: loading (LCP ≤ 2.5s), interactivity (INP ≤ 200ms), and stability (CLS ≤ 0.1).
- Fix LCP first — image optimization and preloading deliver the fastest improvements.
- Add dimensions to images to prevent CLS — the simplest fix with the biggest layout stability impact.
- Break up long JavaScript tasks to improve INP — yield the main thread so the browser can respond to user input.
- Use field data for decisions — lab scores help diagnose, but CrUX field data is what Google actually uses.
- Prioritize high-traffic pages — optimize the pages that affect the most users first.
Core web vitals optimization isn’t a one-time project. Every new feature, plugin, or ad integration can introduce performance regressions. Set up monitoring, review scores monthly, and treat performance as a continuous practice — not a checkbox. The sites that consistently rank well aren’t necessarily the fastest. They’re the ones that never let speed slip. And when you’re ready to measure the business impact, connect your speed improvements to form completion rates and conversion events — that’s how you prove ROI on performance work.