Micro-Conversions That Predict Revenue: Track the Small Actions That Drive Big Results
Your analytics dashboard shows two types of conversions: the ones that make money and the ones that don’t seem to matter. But here’s the thing — some of those “minor” actions your users take are actually strong predictors of whether they’ll eventually buy. Ignore them, and you’re flying blind on what’s really driving revenue.
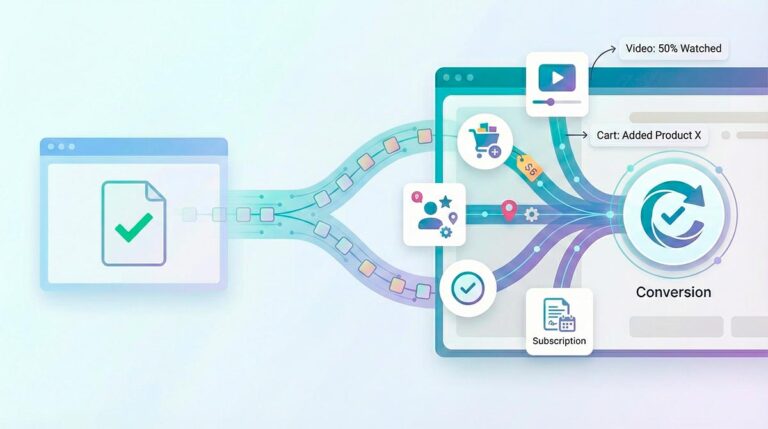
These are micro-conversions — small, measurable actions that signal a user is moving toward a purchase or signup. They don’t generate revenue directly, but they correlate strongly with the actions that do. Tracking them gives you an early warning system for your funnel and a way to optimize for outcomes before the final conversion happens.
In this guide, I’ll show you how to identify which micro-conversions actually predict revenue for your business, how to track them in GA4, and how to use them to make smarter marketing decisions. No vanity metrics — just the signals that matter.
What are micro-conversions?
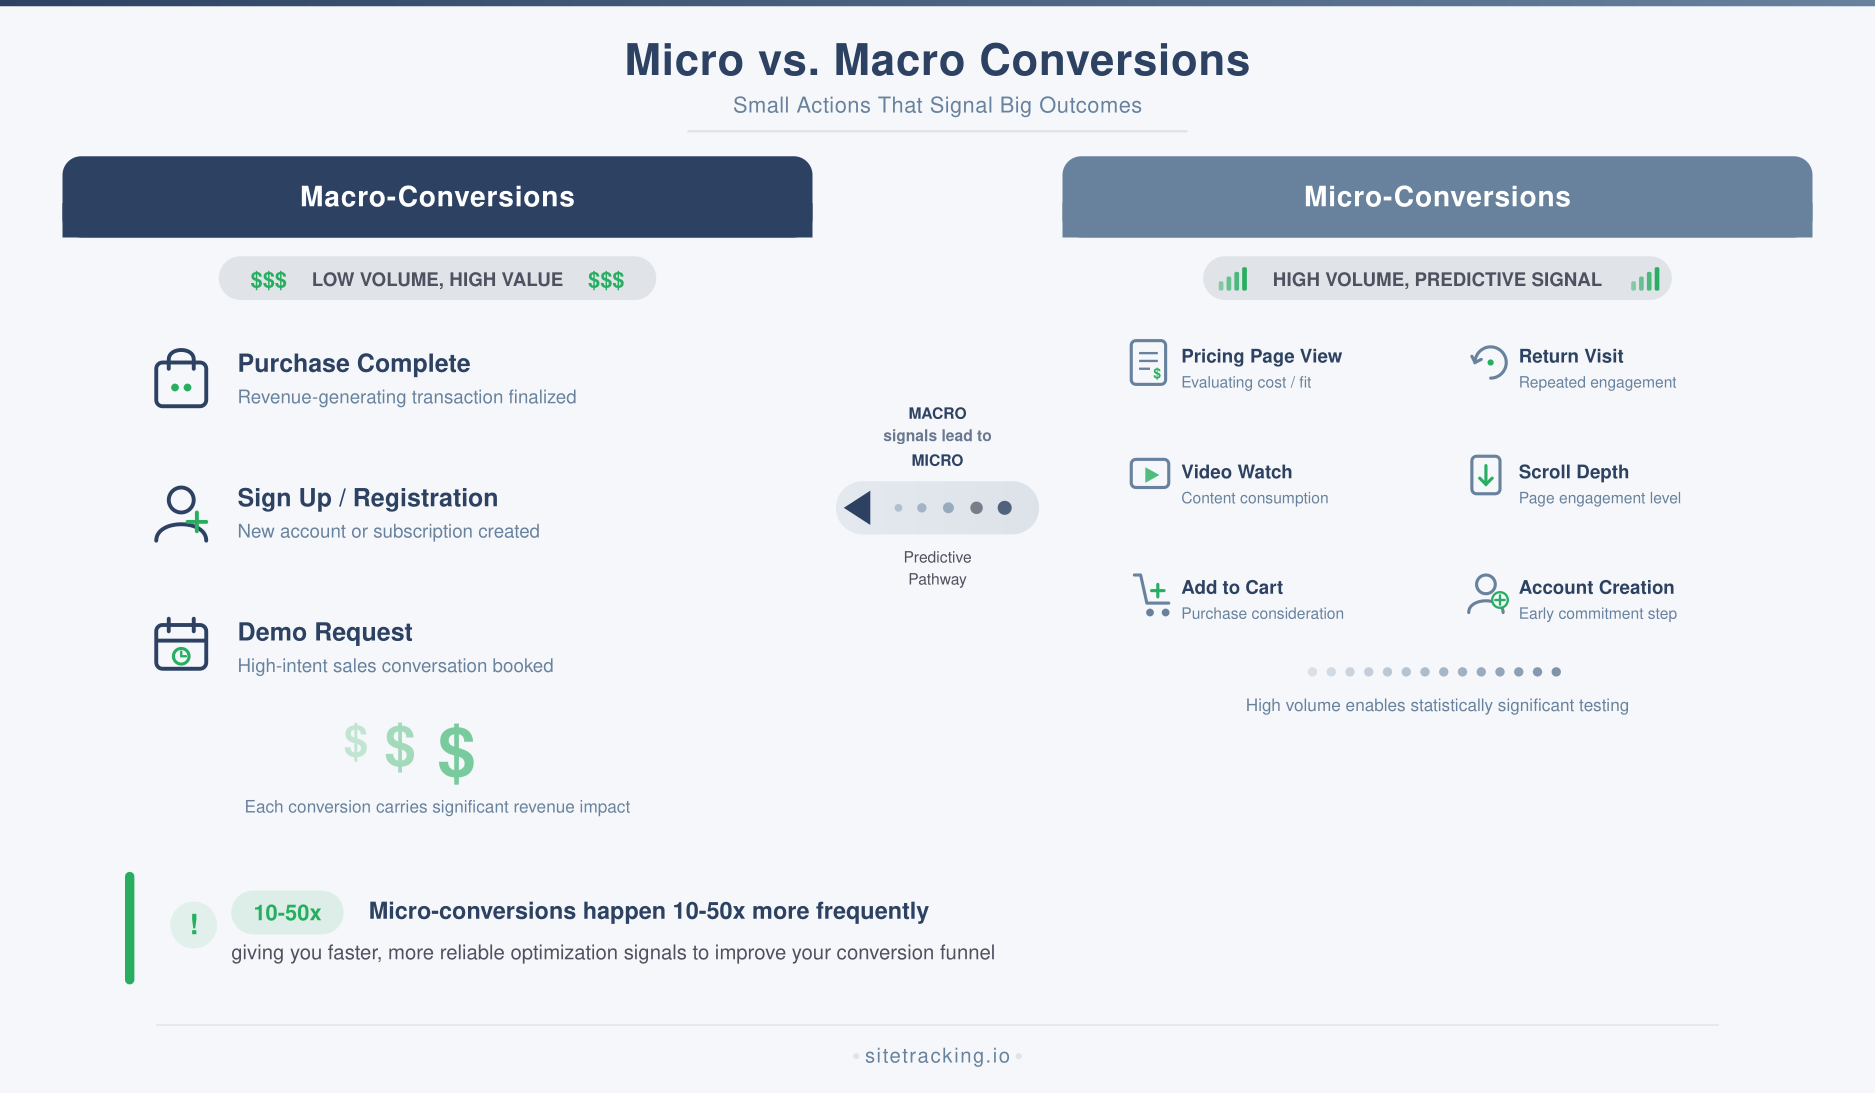
A micro-conversion is any user action that indicates progress toward a macro-conversion (your primary business goal). If your macro-conversion is a purchase, micro-conversions might include adding an item to cart, viewing the pricing page, or creating an account. If your macro-conversion is a demo request, micro-conversions could be watching a product video, downloading a whitepaper, or visiting the “About” page.
The key distinction: not all user actions are micro-conversions. A pageview is just a pageview. But a pageview on your pricing page? That’s a signal. The difference is predictive power — does this action make it more likely that the user will convert? If the data says yes, it’s a micro-conversion worth tracking as a conversion event.
Why micro-conversions matter for revenue
Tracking only macro-conversions is like grading a student only on the final exam. You miss all the signals that predict whether they’ll pass or fail. Micro-conversions solve three specific problems.
They give you faster feedback
Macro-conversions are rare events. On most sites, fewer than 3% of visitors convert. That means you need thousands of visits before you have statistically meaningful conversion data. Micro-conversions happen more frequently, giving you reliable signals in days instead of weeks. This is critical for A/B testing and campaign optimization.
They reveal funnel problems early
If your pricing page views drop by 30% but your traffic stays flat, something upstream is broken — maybe your messaging changed, or a CTA button is failing. You’d catch this immediately with micro-conversion tracking, but you wouldn’t notice for weeks if you only watched final purchases.
They improve audience targeting
Users who complete micro-conversions are higher-quality prospects. Building retargeting audiences around these signals — people who viewed pricing, downloaded resources, or watched demos — gives you more efficient ad spend and higher return. You can use your attribution model to measure how these micro-conversion audiences perform compared to broader targeting.
Micro-conversions that actually predict revenue
Not all micro-conversions are created equal. These are the ones I’ve seen consistently correlate with downstream revenue across dozens of sites and industries.
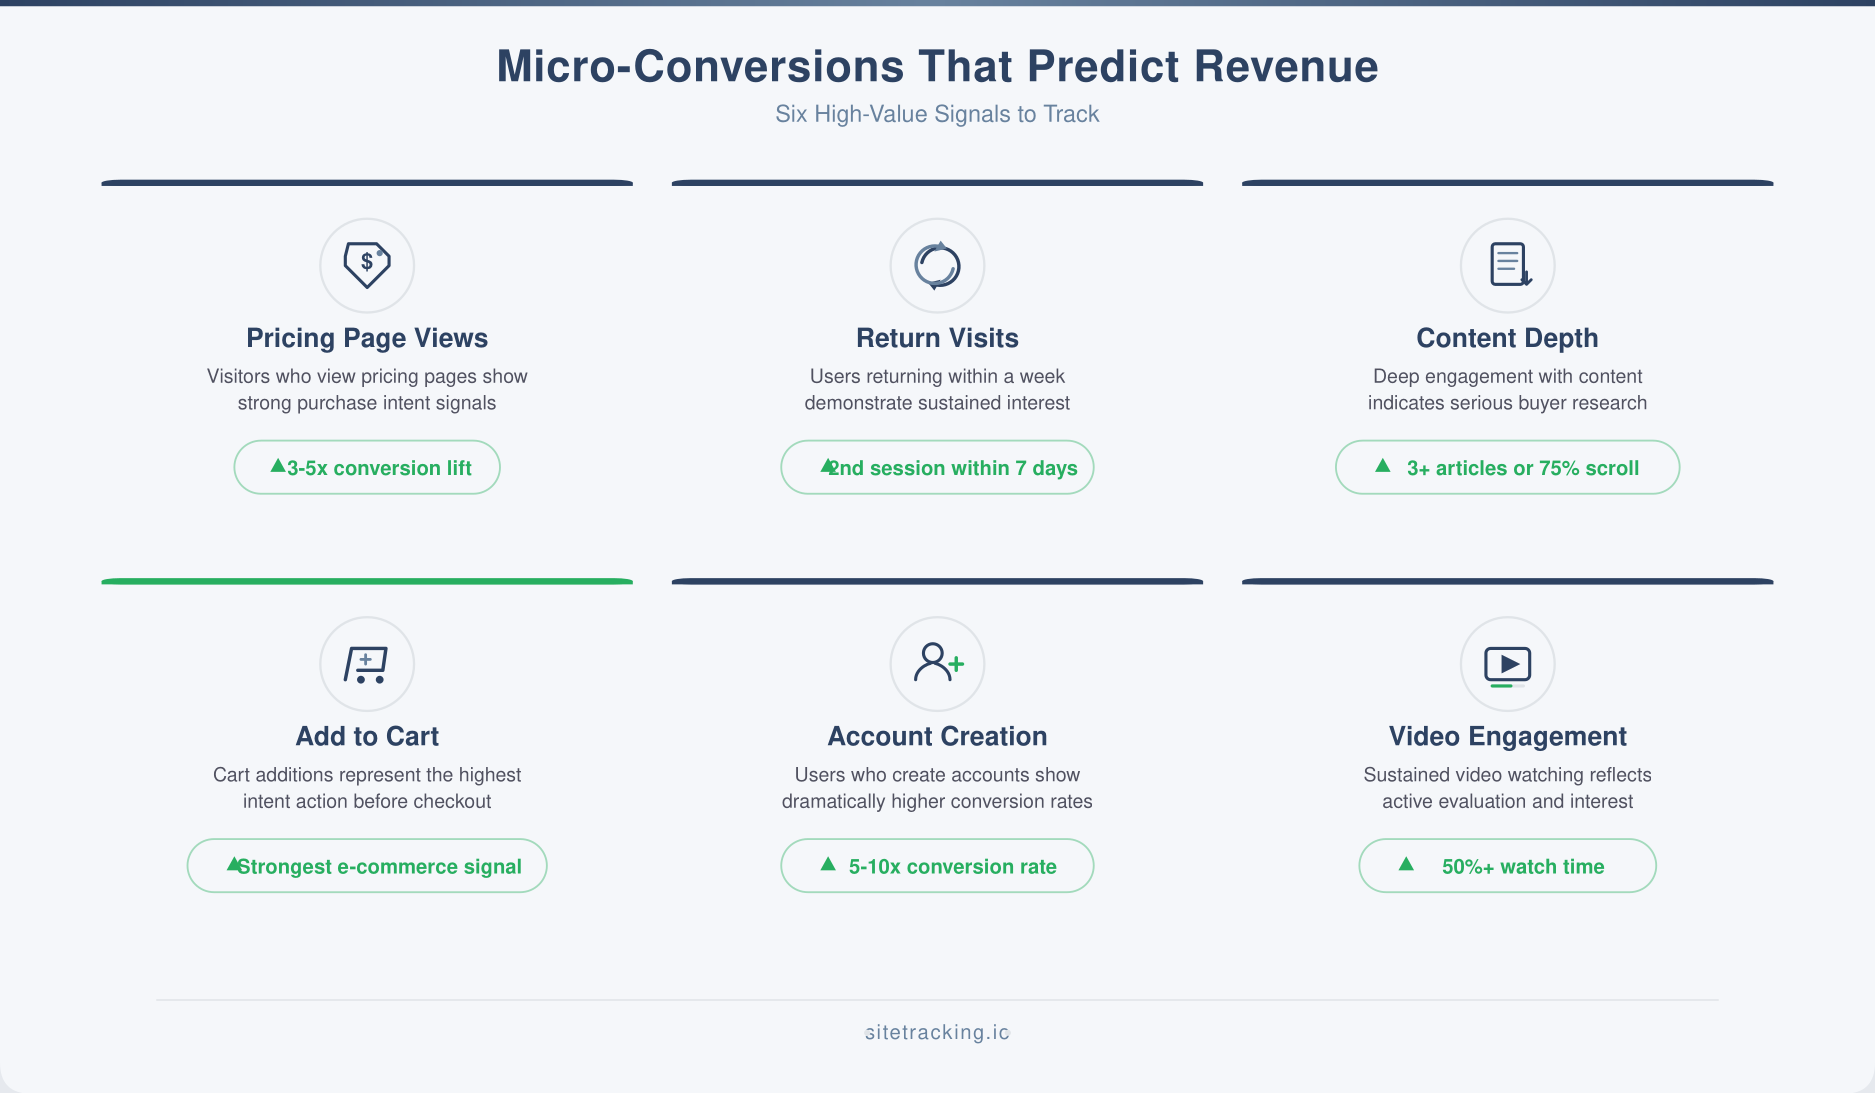
Pricing page views
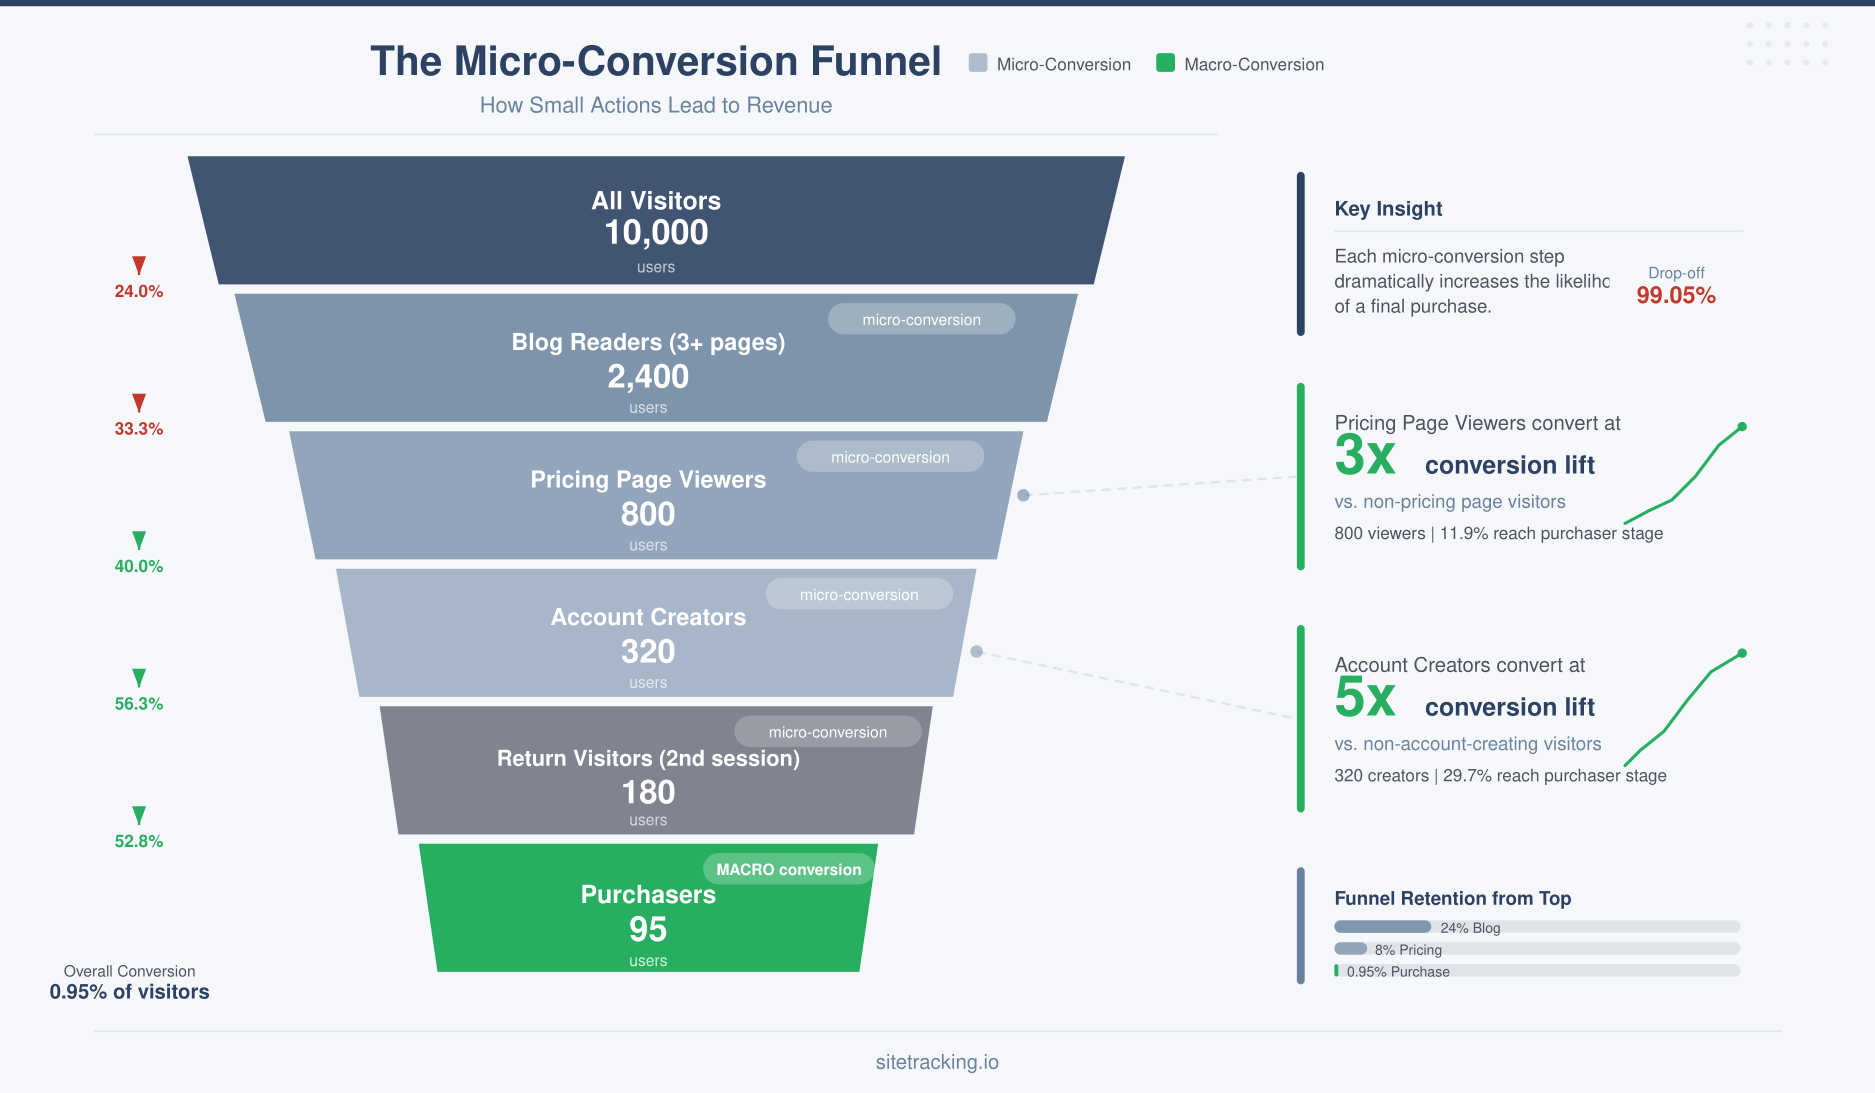
This is the single most predictive micro-conversion for most B2B and SaaS sites. A user who views your pricing page is actively evaluating whether to buy. In my experience, pricing page viewers convert at 3-5x the rate of general site visitors. Track this as a GA4 event and build audiences around it.
Second session return visits
A user who comes back for a second session within 7 days is significantly more likely to convert than a single-session visitor. This applies across almost every industry. The return visit signals genuine interest rather than casual browsing. Track session count as a user property and create segments around multi-session users.
Content depth engagement
Users who read 3+ articles in a single session or scroll past 75% on a long-form page are displaying research behavior. They’re actively learning about your topic area, which correlates with eventual conversion. This is especially strong for content-driven businesses where internal linking guides users through related content.
Add-to-cart or save actions
For e-commerce, add-to-cart is the most obvious micro-conversion. But also track wishlist additions, “save for later” clicks, and product comparison actions. Each of these signals purchase intent at different stages of the buying cycle.
Account creation without purchase
When someone creates an account before buying, they’re committing to your platform. This is a strong conversion predictor — account creators convert at 5-10x the rate of anonymous visitors over the following 30 days. Track the gap between account creation and first purchase to optimize your onboarding sequence.
Video or demo engagement
Users who watch more than 50% of a product demo or explainer video are actively evaluating. Track video progress milestones (25%, 50%, 75%, complete) as separate events. The 50% and 75% marks are typically the strongest conversion predictors.
How to identify your highest-value micro-conversions
The examples above are starting points, but every business is different. Here’s the process to find which specific actions predict revenue on your site.
Step 1: List all trackable user actions
Map every meaningful interaction on your site: page views by category, button clicks, form starts, scroll depth thresholds, video plays, downloads, search queries, filter usage, and account actions. Use your event naming conventions to organize these consistently.
Step 2: Correlate with macro-conversions
For each action, calculate the conversion rate of users who performed it versus those who didn’t. In GA4 Explorations, create a segment for users who did the action and compare their macro-conversion rate to the site average. Actions with conversion rates 2x or higher than the baseline are strong micro-conversion candidates.
Step 3: Validate with volume
A micro-conversion needs sufficient volume to be useful. If only 12 people per month view your case studies page, even a high correlation isn’t statistically meaningful. Focus on actions that at least 5% of your visitors perform. You need enough volume to build reliable audiences and make optimization decisions.
Step 4: Score and prioritize
Rank your micro-conversions by a simple score: (conversion lift) x (monthly volume). This gives you the actions that have both high predictive power and enough data to act on. Your top 5-7 micro-conversions become your tracking priorities.
Tracking micro-conversions in GA4
Once you’ve identified your key micro-conversions, set them up properly in GA4.
- Mark them as key events. In GA4, go to Admin → Events and toggle the “Mark as key event” switch for each micro-conversion event. This makes them available in standard reports and Google Ads.
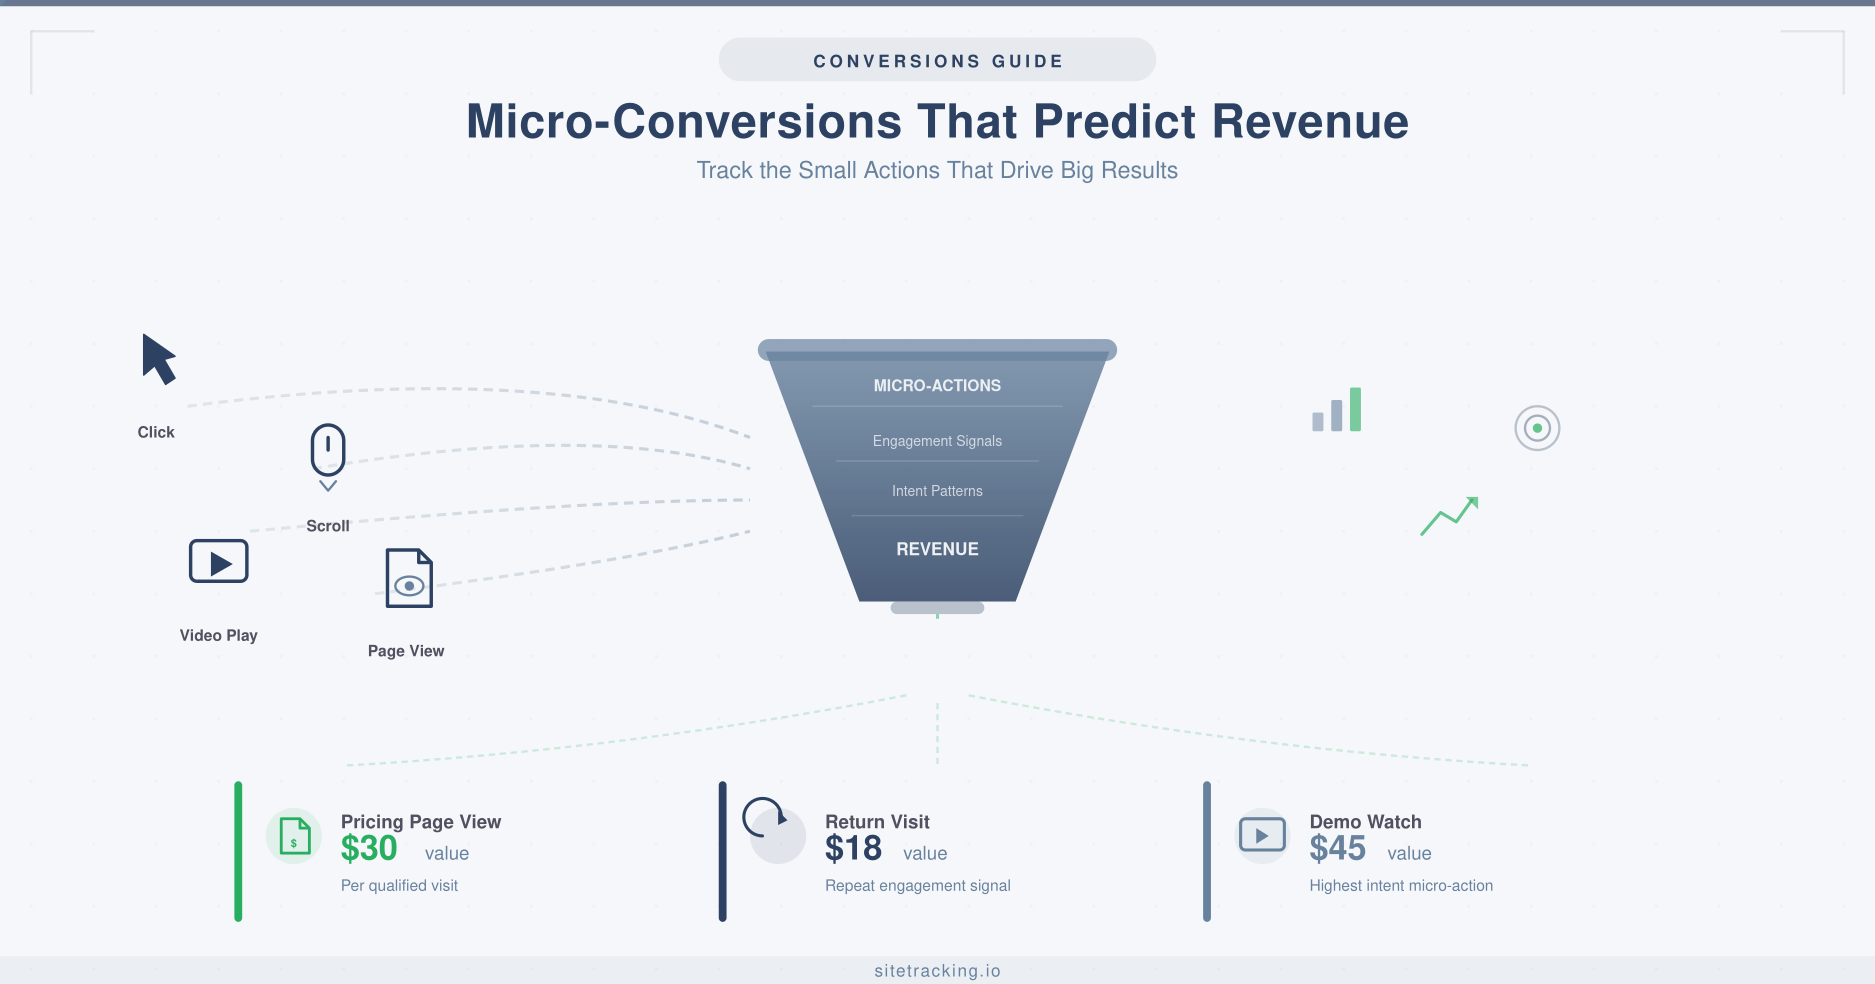
- Assign monetary values. If you know the average revenue generated by users who complete each micro-conversion, assign that value to the event. For example, if pricing page viewers have a 15% conversion rate and your average order is $200, the pricing page view is worth roughly $30 (0.15 × $200).
- Build funnel explorations. Create a funnel that maps your micro-conversion sequence. This shows the path from first touch to final conversion and highlights where users advance or drop off.
- Create audience segments. Build GA4 audiences for each micro-conversion. These audiences auto-sync to Google Ads for targeting and to BigQuery for deeper analysis.
- Set up custom alerts. Configure GA4 custom insights to notify you when micro-conversion rates change significantly. A sudden drop in pricing page views could signal a site issue before it shows up in revenue.
Connect your micro-conversion data to your landing page tracking to see which entry points drive the highest-quality micro-conversions. This helps you allocate budget to the campaigns that attract users who actually progress through your funnel.
Using micro-conversions to optimize marketing
Micro-conversions become most powerful when you use them to make marketing decisions.
- Optimize ad bidding. Import micro-conversions into Google Ads as secondary conversions. Bid on campaigns that drive pricing page views, not just final purchases. This gives the algorithm more signal to work with, especially for longer sales cycles.
- Improve content strategy. Identify which blog posts and pages drive the most micro-conversions. Double down on those content types and topics. If your product comparison posts drive 3x more pricing page views than how-to guides, shift your editorial calendar accordingly.
- Refine email nurturing. Segment email lists by micro-conversion stage. Users who viewed pricing get different messaging than users who only read blog posts. Personalize based on where they are in the funnel, not just whether they’ve subscribed.
- A/B test on micro-conversions. Running A/B tests on macro-conversions requires massive traffic to reach significance. Testing on micro-conversions (like “pricing page click rate”) gives you faster, more reliable results. Just make sure you’ve validated that the micro-conversion actually predicts revenue.
Frequently Asked Questions
How many micro-conversions should I track?
Focus on 5-7 high-value micro-conversions. More than that creates noise and makes reporting complex. You can always add more later, but starting with a focused set gives you cleaner signals and faster insights.
Can a micro-conversion lose its predictive power?
Yes. If you change your site, pricing, or audience, the correlation between a micro-conversion and revenue can shift. Re-validate your micro-conversions quarterly by recalculating conversion lift. If the correlation drops below 1.5x baseline, it’s no longer a reliable signal.
Should I assign dollar values to all micro-conversions?
Assign values to your top micro-conversions — the ones with clear, measurable correlation to revenue. For exploratory or lower-volume micro-conversions, tracking the event without a value is fine. You can always add values later once you have enough data to calculate them accurately.
Key takeaways
- Micro-conversions are early signals that predict which users will eventually generate revenue. Track them to see your funnel clearly.
- Pricing page views, return visits, and content depth are among the most consistently predictive micro-conversions across industries.
- Validate with data — calculate conversion lift and volume for each candidate. Only track actions with 2x+ baseline conversion rate and sufficient volume.
- Assign monetary values to your top micro-conversions so they appear in revenue reports and can guide ad bidding.
- Use micro-conversions for faster optimization — A/B tests, audience targeting, and content strategy all benefit from these higher-frequency signals.
- Re-validate quarterly to ensure your micro-conversions still predict revenue as your business evolves.
The best marketers don’t wait for final conversions to tell them what’s working. They build a system of micro-conversion signals that reveals funnel health in real time. Start by identifying 5-7 actions that correlate with revenue, set them up as key events in GA4, and let the data guide your optimization. You’ll make faster decisions with more confidence — and that directly translates to more revenue.