Marketing Attribution Models Compared: Which One Matches Your Sales Cycle

You’re running ads on Google, posting on LinkedIn, sending email campaigns, and publishing blog content. A lead comes in and eventually converts. But here’s the question that keeps marketers up at night: which channel actually drove that conversion?
The answer depends entirely on your marketing attribution model. Choose the wrong one, and you’ll pour budget into channels that look good on paper but don’t actually move the needle. Choose the right one, and you’ll finally understand where your money is working hardest.
In this guide, I’ll break down the six most common marketing attribution models, show you how each one distributes credit, and help you pick the model that actually matches your sales cycle. No theory for theory’s sake — just practical frameworks you can apply this week.
What are marketing attribution models?
Marketing attribution models are rules that determine how credit for conversions gets divided among the touchpoints in a customer’s journey. In other words, they answer a simple question: who gets the credit?
Consider a typical B2B journey. A prospect clicks a Google Ad, reads a blog post a week later, opens an email campaign, and finally books a demo through a LinkedIn retargeting ad. Four touchpoints, one conversion. How you assign credit to each touchpoint shapes every budget decision you make.
There’s no single “correct” model. Each one reflects a different philosophy about what matters most — the first impression, the closing touch, or everything in between. The key is matching the model to your actual sales cycle. For context on what qualifies as a conversion touchpoint, see our guide on what counts as a conversion event.
Marketing attribution models at a glance
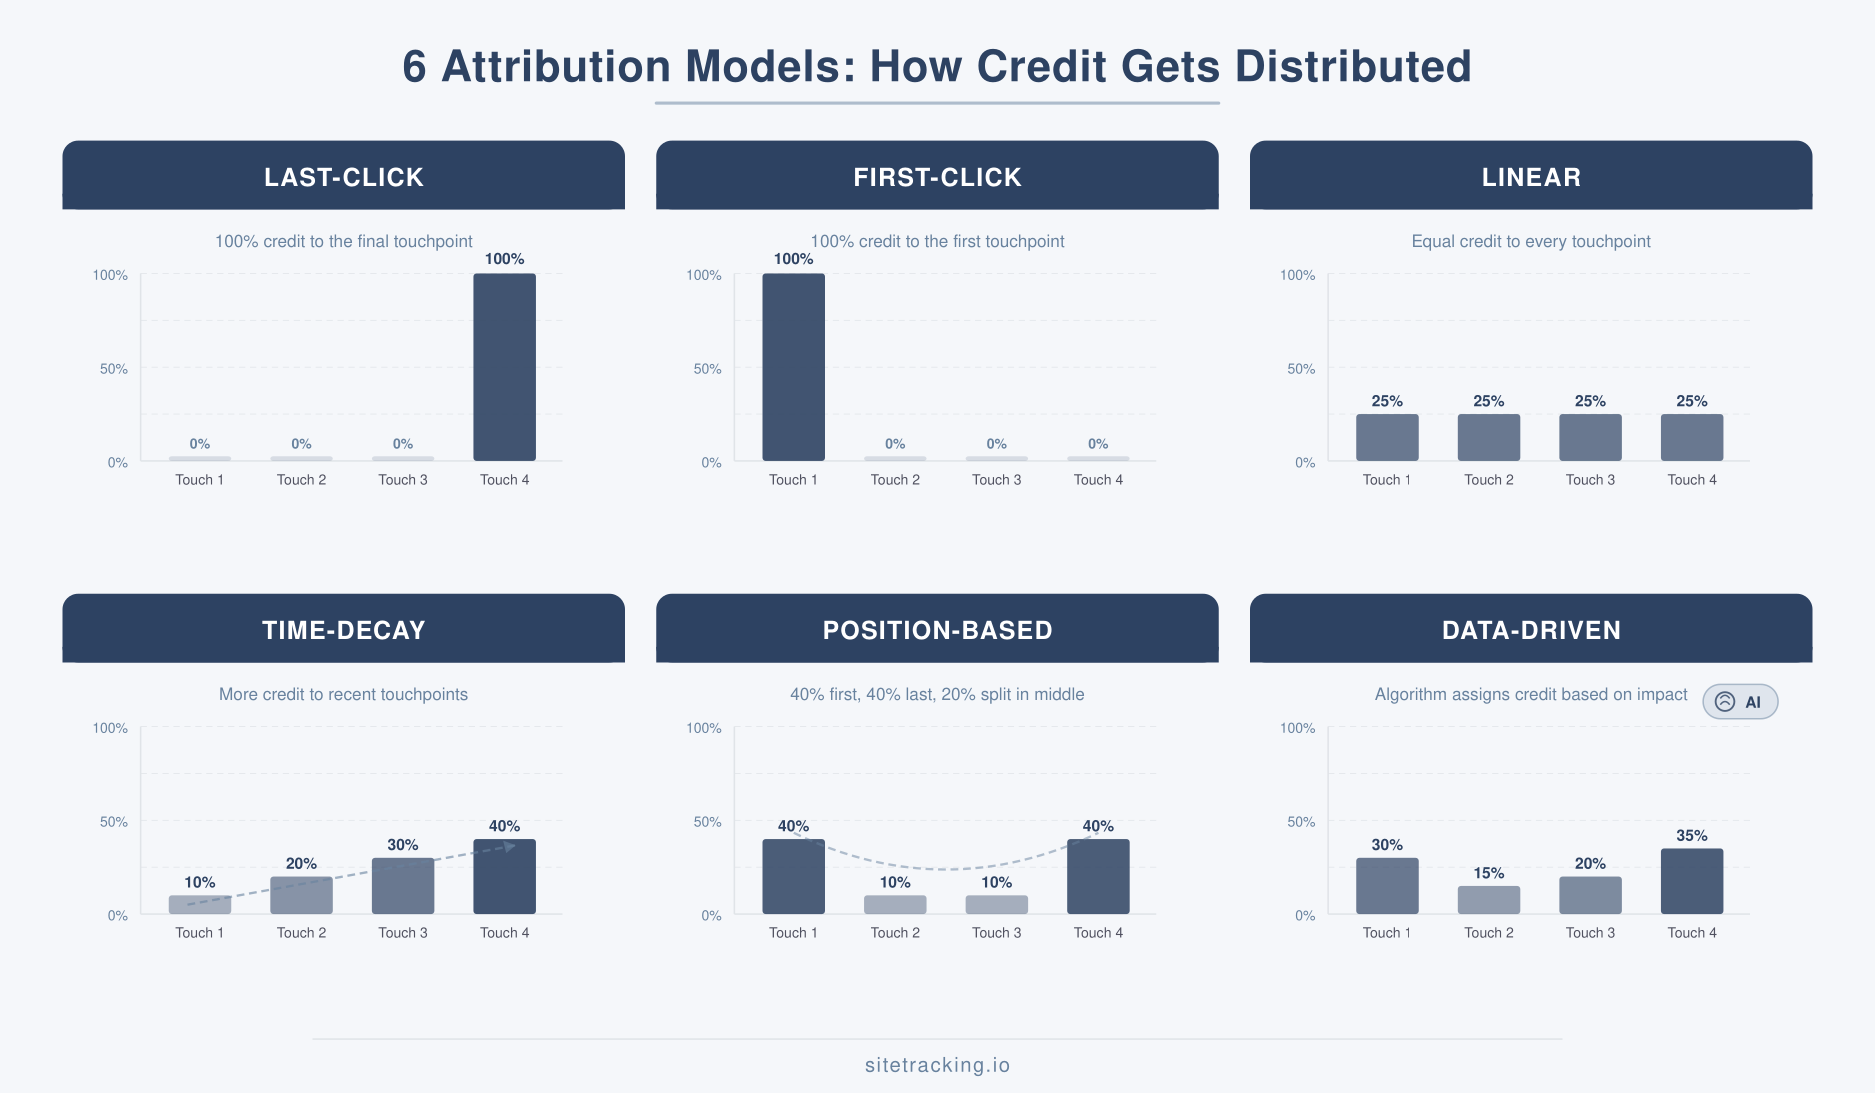
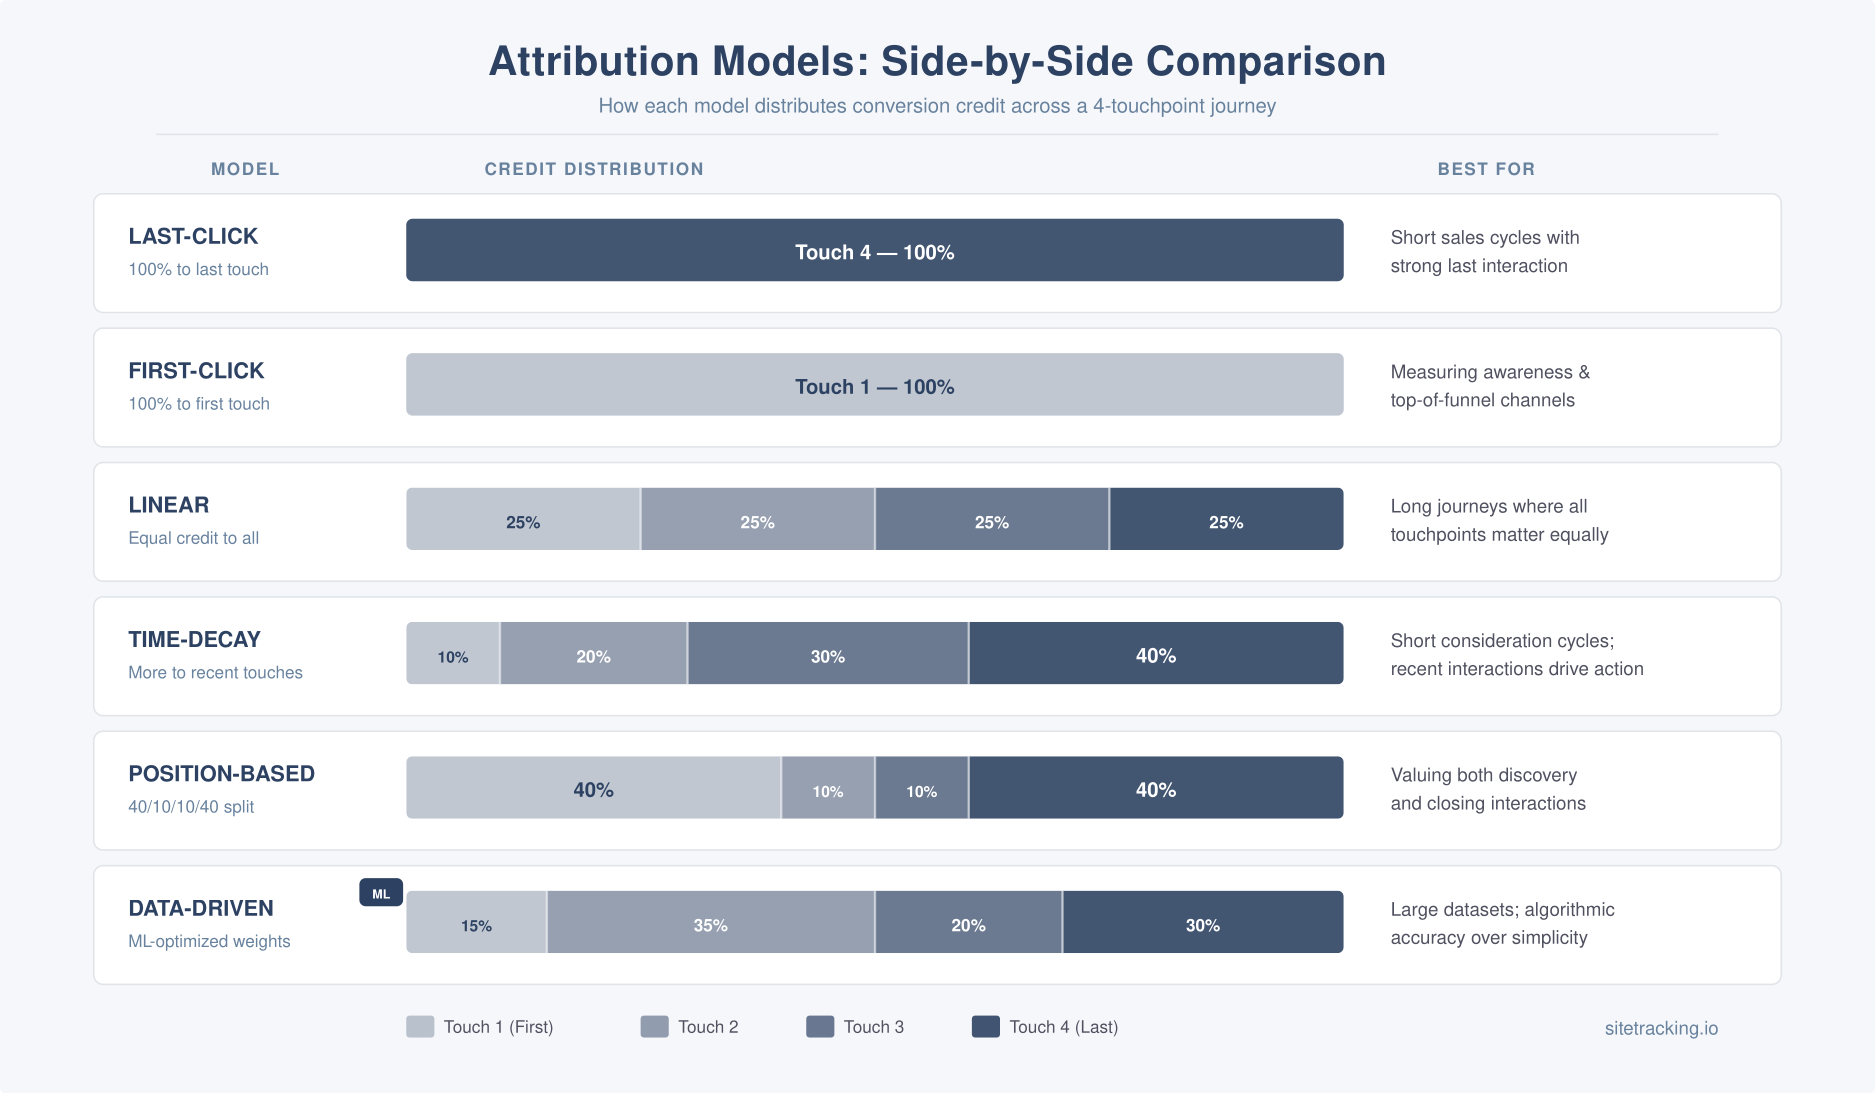
Before diving into each model, here’s a quick comparison to orient you. This table shows how each model distributes credit across a four-touchpoint journey.
| Model | First Touch | Middle Touches | Last Touch | Best For |
|---|---|---|---|---|
| Last-Click | 0% | 0% | 100% | Short sales cycles, direct response |
| First-Click | 100% | 0% | 0% | Brand awareness campaigns |
| Linear | 25% | 25% each | 25% | Balanced view, simple teams |
| Time-Decay | 10% | 20-30% | 40% | Long nurture cycles |
| Position-Based | 40% | 10% each | 40% | Lead gen with nurture |
| Data-Driven | Varies | Varies | Varies | Mature teams with enough data |
Now let’s break down what each model actually does, and more importantly, when it makes sense to use it.
Last-click attribution: the simple default
Last-click gives 100% of the credit to the final touchpoint before conversion. It’s the most common model — and for years, it was the default in Google Analytics.
How it works: A visitor sees your Facebook ad, clicks a Google search result a week later, then converts through an email link. In last-click, the email gets all the credit. Facebook and Google Search get nothing.
When it makes sense: Last-click works well for short sales cycles where the decision happens fast. Think e-commerce impulse purchases, single-session signups, or direct-response campaigns. If most of your conversions happen in one or two sessions, last-click gives you a reasonable picture.
The problem: It completely ignores everything that happened before the final click. For longer sales cycles, this means your top-of-funnel efforts — the channels that introduced people to your brand — look useless. Consequently, teams using last-click often underinvest in awareness channels.
First-click attribution: the awareness view
First-click is the mirror image of last-click. It gives 100% of the credit to the very first touchpoint — the channel that introduced the customer to your brand.
How it works: Same scenario. The Facebook ad that first caught the prospect’s attention gets all the credit. Google Search and the email campaign get zero.
When it makes sense: First-click is useful when you specifically want to understand which channels are best at generating new audiences. If your primary goal is brand discovery — building the top of the funnel — first-click highlights where those initial impressions come from.
The problem: It overvalues awareness and ignores the nurturing work that actually closes deals. A channel might be great at attracting visitors who never convert. First-click can’t tell you that. As a result, it’s rarely used as a primary reporting model.
Linear attribution: equal credit for everyone
Linear attribution splits credit equally across all touchpoints. If there were four interactions before conversion, each one gets 25%.
How it works: Facebook ad, Google Search, blog visit, email click — each gets exactly 25% of the conversion credit. No touchpoint is considered more important than any other.
When it makes sense: Linear is a good starting point for teams that are new to multi-touch attribution. It acknowledges that every interaction plays a role, which is better than giving everything to one touchpoint. Additionally, it’s simple to explain to stakeholders who aren’t data-savvy.
The problem: Not all touchpoints are created equal. A casual blog visit shouldn’t get the same credit as the demo request that closed the deal. Linear is democratic, but reality isn’t. Therefore, it tends to smooth out the differences that actually matter for optimization.
Time-decay attribution: recent touches matter more
Time-decay gives more credit to touchpoints that happened closer to the conversion. The further back an interaction occurred, the less credit it receives.
How it works: Using a standard 7-day half-life, a touchpoint from 7 days before conversion gets half the credit of the final touchpoint. One from 14 days out gets a quarter. The math weighs recency heavily.
When it makes sense: Time-decay works well for longer sales cycles where the later stages — evaluation, comparison, decision — are the most critical. B2B sales, SaaS trials, and high-consideration purchases all benefit from this model. In these scenarios, the interactions closest to the decision point usually have the most influence.
The problem: It still undervalues initial discovery. If a prospect first heard about you through a conference keynote three months ago, that touchpoint gets almost zero credit — even though without it, the entire journey never starts. Moreover, the default half-life setting may not match your actual sales cycle length.
Position-based attribution: the U-shaped model
Position-based (also called U-shaped) attribution gives 40% credit to the first touch, 40% to the last touch, and distributes the remaining 20% equally among all middle touchpoints.
How it works: In our four-touchpoint example, the Facebook ad (first) gets 40%, the email (last) gets 40%, and Google Search and the blog visit each get 10%. The model values both discovery and closing.
When it makes sense: Position-based is popular with B2B and lead-gen teams because it respects both sides of the funnel. The first touch brought the lead in. The last touch converted them. Everything in between helped, but those two moments are usually the most actionable for optimization.
The problem: The 40/20/40 split is arbitrary. In reality, some middle touchpoints — like a detailed case study or product demo — might be far more influential than their 10% credit suggests. Also, it doesn’t adapt to different journey lengths or patterns.
Data-driven attribution: let the algorithm decide
Data-driven attribution (DDA) uses machine learning to analyze all your conversion paths and assign credit based on what actually influenced outcomes. It’s the default model in Google Analytics 4.
How it works: The algorithm compares converting paths against non-converting paths. If users who saw a YouTube ad were significantly more likely to convert later, YouTube gets more credit — even if it wasn’t the first or last touch. The model essentially calculates each channel’s incremental contribution.
When it makes sense: Data-driven attribution is the most accurate option if you have enough data. Google requires at least 300 conversions and 3,000 ad interactions over 30 days. For mature marketing operations with sufficient volume, it removes the guesswork of choosing a static model.
The problem: It’s a black box. You can see the results, but you can’t fully explain why one channel got 32% credit and another got 18%. Additionally, data-driven models can shift suddenly when you change campaigns, making historical comparisons tricky. Teams with low conversion volumes won’t have enough data to make it reliable.
Which marketing attribution model matches your sales cycle?
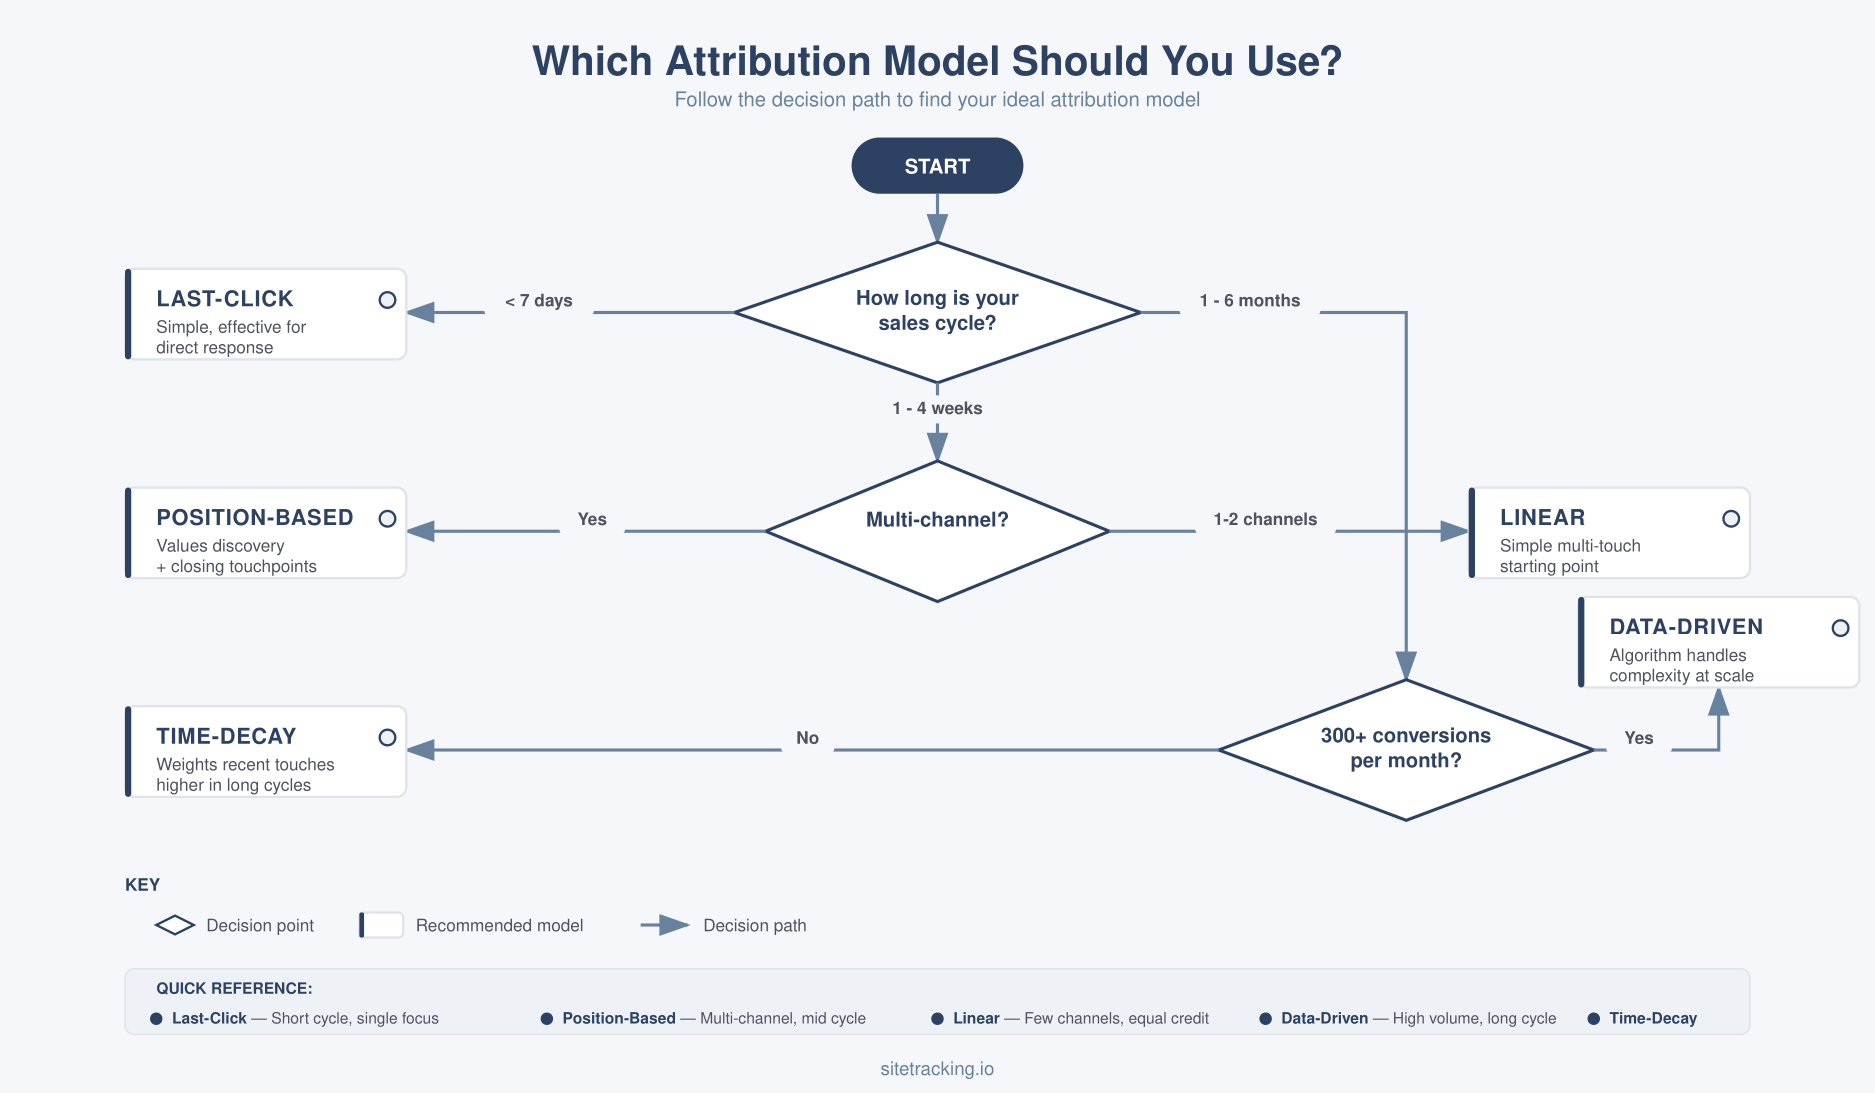
Here’s the practical framework I use when advising teams on model selection. The right model depends on three factors: how long your sales cycle is, how many touchpoints are typical, and what you’re trying to optimize.
Short sales cycles (under 7 days)
If most conversions happen within a few days — or even a single session — keep it simple. Last-click works fine here. The journey is short enough that the final touchpoint genuinely represents the decision. Common examples include e-commerce purchases, free trial signups, and content downloads.
Medium sales cycles (1-4 weeks)
For SaaS products, mid-range B2B services, and considered purchases, the journey typically involves 3-5 touchpoints. Position-based attribution is often the best fit. It credits both the channel that introduced the lead and the one that closed it, while still acknowledging the middle steps. Alternatively, linear works as a stepping stone if your team is new to multi-touch thinking.
Long sales cycles (1-6 months)
Enterprise B2B, complex services, and high-value products often have dozens of touchpoints over months. Time-decay works well here because the later-stage nurturing — case studies, demos, proposals — genuinely carries more weight in the decision. If you have enough conversion volume, data-driven is even better since it can account for the full complexity of these journeys.
Brand-building focus
If your current priority is growing audience reach rather than optimizing conversions, run first-click as a supplementary view alongside your primary model. This helps you understand which channels excel at discovery — valuable intel for budget planning even if it’s not your main reporting model.
How to set up attribution in GA4
GA4 uses data-driven attribution by default. However, you can change the reporting model and adjust settings. Here’s what to know.
Change your attribution model: Go to Admin → Attribution Settings. Choose between data-driven (default), last-click (paid and organic), or last-click (Google paid channels only). Note that GA4 no longer supports first-click, linear, time-decay, or position-based as selectable models — Google deprecated these in 2023.
Set your lookback window: In the same settings, define how far back GA4 looks for touchpoints. The default is 30 days for acquisition events and 90 days for other conversions. If your sales cycle is longer, extend the window accordingly.
Use Model Comparison in Explorations: Even though GA4 limits your reporting model options, you can still compare models using the Attribution → Model Comparison report. This is the best way to see how credit shifts between data-driven and last-click without changing your default settings.
For teams tracking conversions on landing pages, make sure your landing page conversion tracking is solid before analyzing attribution. Broken event tracking undermines any attribution model.
Common marketing attribution mistakes
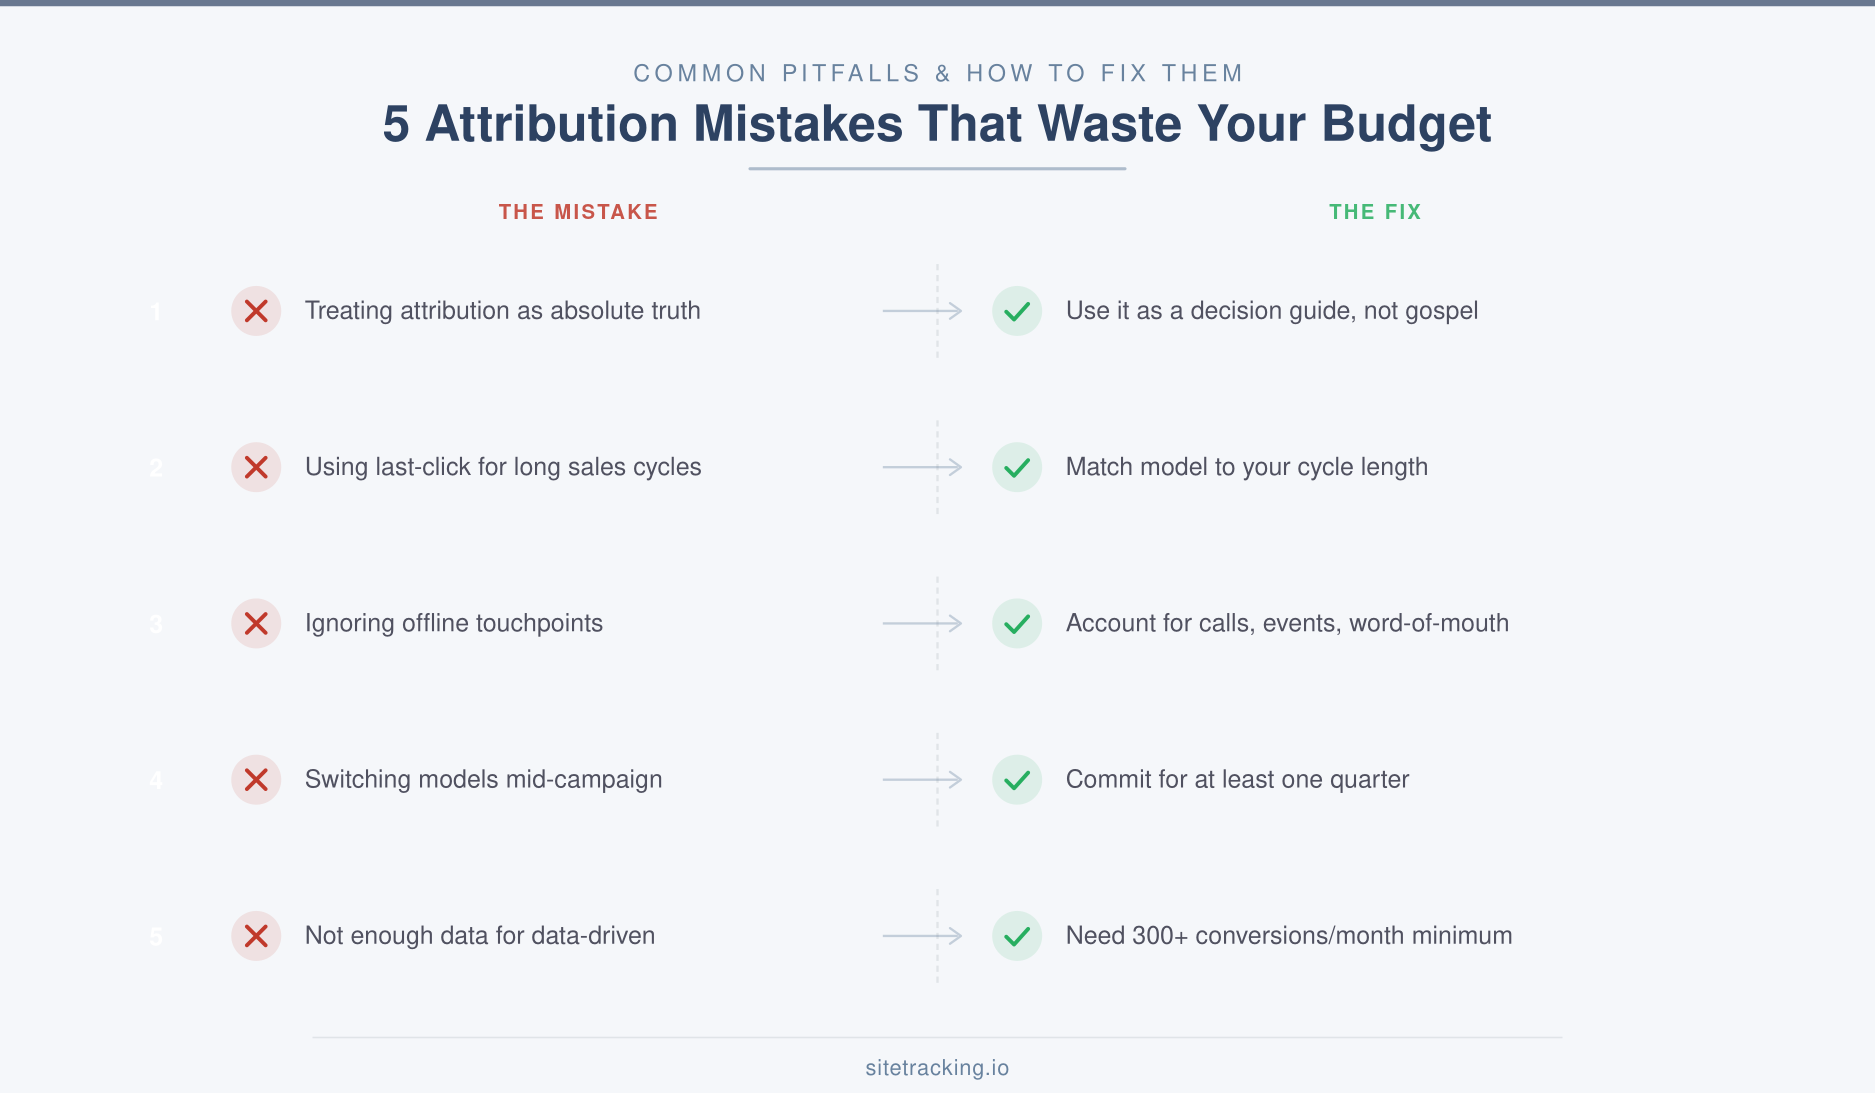
I’ve worked with dozens of teams on attribution, and the same mistakes come up again and again. Here are the ones that cause the most damage.
- Treating attribution as truth. No model perfectly reflects reality. Attribution is a useful lens, not an exact measurement. Use it to guide decisions, not dictate them.
- Using last-click for everything. Last-click is fine for short cycles, but applying it to a 3-month B2B journey is misleading. It will make your nurture campaigns look worthless and your closing channels look like heroes.
- Ignoring offline touchpoints. Most attribution models only track digital interactions. If sales calls, events, or word-of-mouth play a role in your funnel, your attribution data has blind spots. Account for this when making budget decisions.
- Switching models mid-campaign. Changing attribution models makes period-over-period comparisons meaningless. Pick a model, stick with it for at least a quarter, and use model comparison reports for side-by-side analysis instead.
- Not having enough data for data-driven. Data-driven attribution needs significant conversion volume to work reliably. If you’re getting fewer than 300 conversions per month, the algorithm won’t have enough signal. In that case, position-based or time-decay gives you a more stable foundation.
Frequently Asked Questions
Which marketing attribution model is most accurate?
Data-driven attribution is generally the most accurate because it uses your actual data rather than predetermined rules. However, accuracy depends on having enough conversion volume (300+ per month). For smaller datasets, position-based or time-decay provides more reliable insights than data-driven with insufficient data.
Can I use multiple attribution models at the same time?
Yes, and you should. Use one model as your primary reporting standard, but compare it against others using GA4’s Model Comparison report. For example, you might report on data-driven attribution for budget decisions while checking first-click to evaluate brand awareness channels. This gives you multiple perspectives without creating confusion.
Why did Google remove most attribution models from GA4?
Google deprecated first-click, linear, time-decay, and position-based models in GA4 in late 2023. Their reasoning was that data-driven attribution is more accurate for most accounts, and maintaining multiple rule-based models created complexity without proportional value. You can still compare these models in third-party tools or GA4’s Explorations.
Key takeaways
- Marketing attribution models determine how conversion credit is distributed — and directly shape your budget decisions.
- Last-click works for short sales cycles. For anything longer, you need multi-touch attribution.
- Position-based is the best general-purpose model for lead gen — it values both discovery and closing.
- Data-driven is the most accurate, but only if you have enough conversion volume (300+ per month).
- Match the model to your sales cycle — short cycles need simple models, long cycles need weighted or algorithmic ones.
- Compare models side by side using GA4’s attribution reports before committing to one.
Attribution isn’t about finding the one “true” answer. It’s about picking a consistent framework that helps you make better budget decisions over time. Start with the model that matches your sales cycle, compare it against at least one alternative, and revisit your choice as your data matures.