
Analytics Audit Checklist: How to Vet a GA4 Property You Inherited
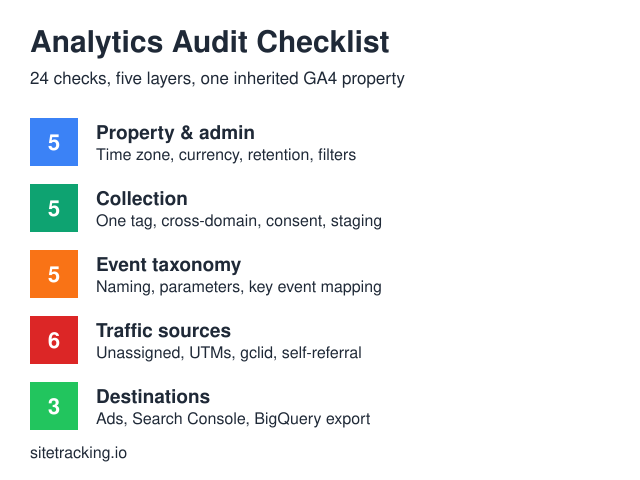
You’ve inherited a GA4 property. New client, new job, or the analyst who built it left and took the context with them. An analytics audit checklist is how you work out — in days rather than a quarter — which numbers you can defend in a meeting and which you should quietly stop quoting. Twenty-four checks across five layers: property settings, collection, event taxonomy, traffic sources, and integrations. On a mid-sized property it’s under a day of work.
In my experience three failures do most of the damage: a duplicated Google tag that counts every page view twice, internal traffic that nobody ever filtered out, and key events pinned to scrolls and clicks that nobody bought anything with. Start with the most diagnostic single view. Open Reports → Acquisition → Traffic acquisition, set the dimension to Session default channel group, and look at Unassigned — the bucket Analytics uses, per Google’s default channel group documentation, “when there are no other channel rules that match the event data”. A small residual is normal. A visible slice means sessions are landing without usable source information, and every channel report in the property inherits that gap.
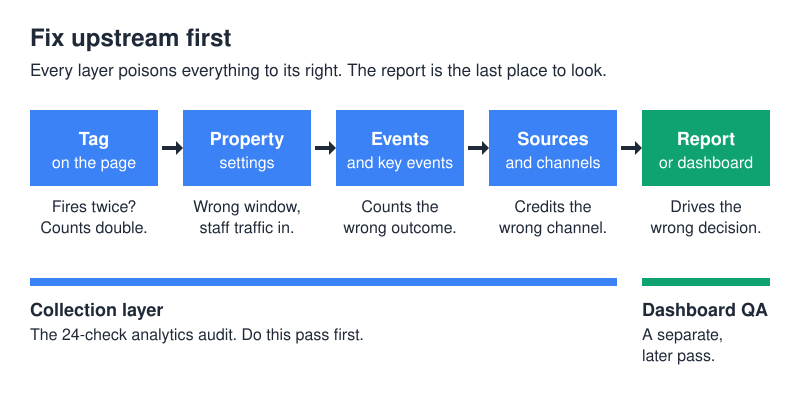
One thing to be clear about up front: this is not dashboard QA. Checking whether the numbers in a finished report reconcile is a separate job, and I’ve written a dashboard QA checklist for that. This audit sits one layer upstream, in the collection itself. Verifying a dashboard fed by a broken tag just gives you a very confident wrong answer.
What breaks first in a GA4 property you didn’t build?
Inherited properties fail in the same handful of places, and for boring reasons: somebody shipped a fix, nobody documented it, and the next person shipped a second fix on top.
- The duplicated Google tag. The same
G-measurement ID sits in the theme header and in a Google Tag Manager container. Everypage_viewfires twice. Sessions look fine, but events per session double and any rate with events in it goes sideways. This one makes numbers wrong by a multiple, not a margin. - Self-referral from the payment processor. Checkout hands off to a third-party payment domain and the user comes back. Without configuration, GA4 treats that return as a fresh referral, so the purchase gets credited to the payment provider instead of the campaign you paid for — which quietly rewrites your whole attribution model. Google lists exactly this scenario among the common uses for unwanted referrals, which “appends the
ignore_referrerparameter with a value oftrueto every event that matches the conditions”. - No internal traffic filter. The agency, the client’s marketing team and a QA contractor all hit the site daily. On a high-traffic property that’s noise. On a low-traffic one it’s a measurable slice of your “audience” — and it clusters on exactly the pages you’re evaluating.
- Key events on scroll and click. Somebody needed a conversion number for a report, so they marked
scrollas a key event. Now the property books a “conversion” every time somebody scrolls. Worse, if it’s linked to Google Ads, the bidding algorithm may be optimising toward scrolling. - The
gclidlost to a redirect. Google Ads appends agclidparameter to the landing page URL. If a redirect in the chain — HTTP to HTTPS, trailing slash, geo-routing — drops the query string, that click arrives with no ad context. It lands in Direct or Unassigned, and paid search looks like it’s underperforming when it’s really just invisible.
Notice the pattern: not one of them is a reporting problem. None can be fixed inside a dashboard, and no amount of chart-level checking will surface them.
The analytics audit checklist: 24 checks across five layers
Here’s the working document. I run it top to bottom because the layers are ordered by blast radius: a property-level misconfiguration corrupts everything below it, a missing BigQuery export corrupts nothing. Each row says where to look, what counts as a pass, and how hard to push if it fails.
| Layer | Check | Where to look | Pass condition | Severity |
|---|---|---|---|---|
| 1. Property | Reporting time zone | Admin → Property settings → Property details | Matches the business reporting calendar and hasn’t been changed mid-history | Distortion |
| 1. Property | Reporting currency | Admin → Property settings → Property details | Matches the currency the store actually charges in | Distortion |
| 1. Property | Data retention | Admin → Data collection and modification → Data retention | Event data set to the longer option, not the short one | Distortion |
| 1. Property | Internal traffic filter | Admin → Data streams → Configure tag settings, plus Data filters | An IP rule exists and the filter state is Active, not Testing | Blocker |
| 1. Property | Unwanted referrals | Admin → Data streams → Configure tag settings → List unwanted referrals | Payment, auth and email-link domains all listed | Blocker |
| 2. Collection | One measurement ID per page | Page source, Tag Assistant, network tab | Exactly one G- ID fires per page view, from one place | Blocker |
| 2. Collection | Tag coverage on money pages | Tag Assistant across every template | Tag present on cart, checkout, thank-you and all landing templates | Blocker |
| 2. Collection | Cross-domain configuration | Admin → Data streams → Configure your domains | All owned domains listed; _gl appears on cross-domain links | Blocker |
| 2. Collection | Consent defaults | GTM consent settings or the gtag default consent call | A default consent state is set before the tag fires | Distortion |
| 2. Collection | Staging traffic excluded | Reports → Tech → Tech details → Hostname | No staging, preview or localhost hostnames in the data | Distortion |
| 3. Taxonomy | Naming scheme consistency | Admin → Data display → Events | One casing convention, no near-duplicate names for one action | Distortion |
| 3. Taxonomy | Reserved name collisions | Admin → Data display → Events | No custom event competing with an automatically collected name | Distortion |
| 3. Taxonomy | Parameter budget | DebugView event payloads | No event carrying more than 25 parameters | Hygiene |
| 3. Taxonomy | Truncation risk | DebugView parameter values | Names within 40 characters, values within 100 | Hygiene |
| 3. Taxonomy | Key events map to money | Admin → Data display → Key events | Every key event is an outcome a finance person would recognise | Blocker |
| 4. Sources | Unassigned share | Reports → Acquisition → Traffic acquisition | Unassigned is a small residual, and stable month over month | Blocker |
| 4. Sources | UTM value hygiene | Traffic acquisition → Session source / medium | No casing or spelling variants splitting one channel in two | Distortion |
| 4. Sources | gclid survives redirects | Paste a live ad URL, follow every hop | gclid still present in the final landing URL | Blocker |
| 4. Sources | No self-referral | Traffic acquisition → Session source | Your own domains absent from the source list | Blocker |
| 4. Sources | Channel group definitions | Admin → Data display → Channel groups | Any custom group documented; paid social not sitting in organic | Distortion |
| 4. Sources | No UTMs on internal links | Site crawl, plus landing page report | Internal navigation carries no campaign parameters | Distortion |
| 5. Destinations | Google Ads link | Admin → Product links → Google Ads | Link active, auto-tagging on, import settings intentional | Distortion |
| 5. Destinations | Search Console link | Admin → Product links → Search Console | Linked and the Search Console report actually surfaced in Reports | Hygiene |
| 5. Destinations | BigQuery export | Admin → Product links → BigQuery | Daily export running, with a known start date | Hygiene |
Two rows deserve a footnote. The internal traffic filter is a blocker because of the Testing state: Google’s documentation on filtering internal traffic describes three states, and a filter parked in Testing identifies matching data without excluding it. Plenty of properties have a filter that looks configured and does nothing.
The taxonomy limits come straight from Google’s collection limits documentation: 25 event parameters per event, 40 characters for event and parameter names, 100 for most parameter values. Web data streams have no cap on distinct event names, which is exactly why inherited properties sprawl. If layer three is a mess, the fix is a written convention — I’ve laid one out in GA4 event naming conventions.
In layer four, the UTM checks get argued about most. A utm_medium=email and a utm_medium=Email are two different mediums as far as reporting is concerned, so a campaign split across both is a campaign you under-report. The conventions worth enforcing are in the UTM parameters guide. For the key-event row, my standard is in what counts as a conversion event: if you can’t connect it to revenue in one hop, it isn’t a key event.
How do you tell a real problem from noise?
Here’s the thing about audits: the findings list is the easy part. Anyone can produce a long list of observations about a GA4 property. Ranking them is what makes the audit useful, and most deliverables I’ve seen inherit their ranking from the order the auditor clicked through the admin panel. That’s not a priority order. That’s a browsing history.
I sort everything into three buckets, and the definitions are deliberately blunt:
- Blocker. The number is wrong by a multiple, not a margin. A duplicated tag, a missing internal filter on a low-traffic site, key events on scroll. While a blocker is live, the affected report is unusable — not for budget, not for a board slide, not for “directional” reading. Directional is how a wrong number gets into a decision.
- Distortion. The trend reads correctly, the absolute level doesn’t. A currency mismatch, an undocumented channel group, a consent default that fires late. You can see whether things are going up or down. You just can’t quote the number.
- Hygiene. Cosmetic or preventive. Parameter names close to the character limit, a BigQuery export nobody uses, an unlinked Search Console. Fix it while you’re in there. Never lead a findings report with it.
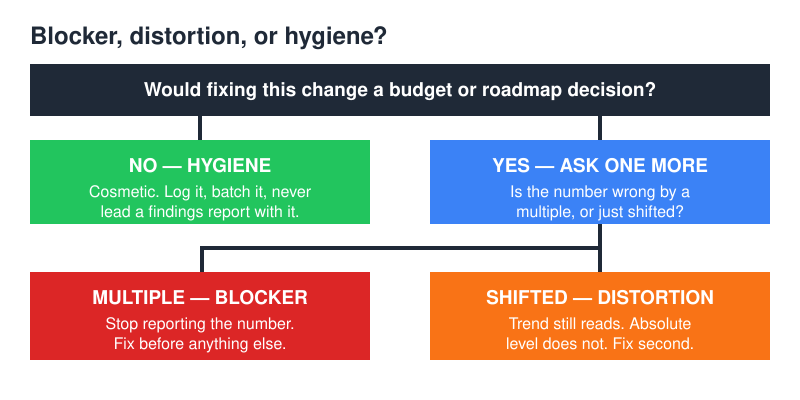
Sorting is fast with one question: would fixing this change at least one decision about budget or roadmap? If the honest answer is no, it’s hygiene, however satisfying the fix would be. If yes, ask the follow-up: wrong by a multiple, or just shifted? Multiple means blocker. Shifted means distortion.
That test does something else, too. It stops you handing a client a wall of findings they can’t act on. A short list of blockers with a named owner and a repair sequence gets more actually fixed than a long inventory sorted by admin-panel order. An audit nobody acts on is just an expensive inventory.
How do you verify each check without guessing?
Every tool in the GA4 stack is honest about something and blind to something else. Knowing which is which saves you from the most expensive audit mistake: declaring a check passed because the tool you used couldn’t have shown you the failure.
- DebugView — the workhorse for layer three. It shows the actual event payload, parameter by parameter, so it’s the only place you’ll reliably catch a missing parameter or a truncated value. It only surfaces sessions you’ve flagged for debugging, and only on a short rolling window — it answers “is this firing correctly right now”, never “was this firing correctly last quarter”. One trap: excluding the
debug_modeparameter is how you turn debug off, and setting it tofalsedoes not. - Tag Assistant and GTM Preview — the only practical way to catch a duplicated tag, because they show every tag that fired, from every source, on one page load. Do it on at least four templates: home, a blog or category page, a form page, and the thank-you page.
- Page source and the network tab — the crude check that catches what Preview mode misses. Search the rendered source for
G-and count the hits, then filter the network tab for collection requests and count those. Two requests per page view means two tags, whatever the container says. - Realtime — fine for confirming a stream is alive or spot-checking a key event you just triggered. Bad for duplicates: two identically configured tags produce two indistinguishable hits, and Realtime counts both without telling you they’re twins.
- Search Console next to GA4 — the sanity check for layer four. The two will never match exactly; they count different things with different bot and consent handling. You’re looking for shape. If organic sessions and organic clicks move together, fine. If the gap widens month over month with nothing else changing, collection is degrading.
- Server logs or a CDN report — your only ground truth, counted before consent, ad blockers and JavaScript. Don’t expect a clean match. But a client-side number far below server-side hits on one template usually means the tag isn’t on it.
Write down what you checked, on which template, on which date. Half the value of an audit is proving, weeks later, that a problem is new rather than old.
What does a passing audit look like?
A pass isn’t zero findings — I’ve never seen zero findings. A pass means no blockers, distortions documented, hygiene items in a dated backlog. Here are the signals I read for the summary line. They’re my own rules of thumb, not published standards — Google doesn’t set a pass mark for any of them — so treat them as a sanity check, not a benchmark.
| Signal | Passing | Investigate |
|---|---|---|
| Unassigned share of sessions | A small residual, flat month over month | A visible slice, or rising month over month |
| Own domains in the traffic source list | Absent | Present at all |
| Collection requests per page view | Exactly one | Two or more |
| Key events | All traceable to revenue in one hop | Any engagement proxy marked as key |
| Organic sessions vs Search Console clicks | Move together month over month | Gap widening with no known change |
| Staging or localhost hostnames in data | None | Any |
For the summary score, resist the urge to invent a percentage. I write three lines: blockers open, distortions documented, hygiene backlog. A stakeholder reads that at a glance and knows whether to trust last quarter’s reporting.
What do you fix first — and what you should never try to backfill?
Repair order follows the layers, not the pain. Property settings, then collection, then taxonomy, then sources, then destinations — and only after all that do you touch reports. It feels backwards, because the dashboard is what people complain about. But fixing a chart on top of a duplicated tag means doing the work twice.
Now the part that surprises people: most GA4 fixes are not retroactive. Changing the reporting time zone, per Google’s property settings documentation, “only affects data going forward” — and the same page warns you’ll see a flat spot or a spike at the moment of the shift. Internal traffic filters apply to future data only. Unwanted referrals don’t reclassify visitors who already arrived. Data retention is the exception: the retention documentation offers 2 or 14 months of event data on standard properties, and if you increase the period “the change is applied to data that you have already collected”. The same page notes the setting “does not affect standard aggregated reports” — only explorations and funnel reports — which is why teams panic about it unnecessarily.
The practical consequence is a cutoff date. Pick the day the last blocker was fixed, annotate it in every report, and refuse to compare across it. Yes, that costs you a year-over-year comparison. Losing one comparison beats building a strategy on a period where the tag fired twice. Where the property goes next — governance, documentation, an owner for the measurement plan — is a different conversation, and the marketing measurement maturity model is the map I use for it.
Once collection is clean and the cutoff is set, then verify the reports themselves. That’s the dashboard QA pass, and it asks different questions: do the filters match the definition, does the total reconcile, does the date range say what the title says. Two passes, in order.
Frequently asked questions
How often should you audit a GA4 property?
My default is a full pass twice a year, plus a mandatory one after a replatform, a new payment provider, a consent banner change, or a handover between teams. Between passes, a short monthly check covers most drift: Unassigned share, own domain in the source list, key event counts against last month. Breakage arrives with deployments, so tie the trigger to releases, not the calendar.
Can you fix historical GA4 data after the audit?
Almost never. Data filters, unwanted referrals and time zone changes all apply going forward only. What you can do is annotate: record the date each fix landed, mark it in every recurring report, and state plainly that earlier periods were measured differently. With BigQuery export running you can sometimes reconstruct a cleaner history from raw events — but that’s a modelling project, not a settings change.
Is an analytics audit the same as dashboard QA?
No, and conflating them is why audits get repeated. An analytics audit checklist examines how data is collected: property configuration, tags, events, source attribution. Dashboard QA examines whether a finished report presents that data correctly — filters, date ranges, totals, definitions. A dashboard can be flawlessly built on top of completely wrong collection.
How long does a full GA4 audit take?
Under a day of actual work for a single-domain property with a moderate event set — though I spread that across several days, so I can watch data land after each change. Add time for cross-domain setups, a server-side container, or a long Tag Manager version history. The checklist moves fast. Layer two is what takes the time — walking real templates in Preview mode and confirming what actually fires.
Do you need BigQuery to audit properly?
No. Every check here can be done in the GA4 interface plus a browser. BigQuery helps in two situations: reconstructing history after a fix, and finding taxonomy problems at scale, where one query surfaces naming variants faster than clicking through the events list. Turn the export on during the audit anyway, so future-you has raw data.
Bottom line
An inherited GA4 property is a claim, not a fact. The analytics audit checklist above turns it into something you can defend: 24 checks, five layers, three severity buckets, one sorting question. Run the collection layer first, set a cutoff date, and don’t promise anyone a backfill. Dashboards are only as good as the events behind them — and the events are only as good as the property settings behind those.