How to Calculate Micro Conversion Rate: Formula, Example, and Benchmarks

Most teams can tell you their checkout conversion rate. Ask them how to calculate micro conversion rate for a pricing-page view or a video play, and you usually get a shrug. That gap is expensive. The big “buy now” number moves slowly, but the small actions that lead to it move every day — and if you’re not measuring them, you’re flying half-blind.
Here’s the thing: the formula itself is simple. A micro conversion rate is just the share of people who completed a smaller, intent-signaling action. The hard part isn’t the math. It’s choosing the right denominator, keeping your scopes straight, and knowing what a healthy number even looks like. In my experience, that’s where most setups quietly go wrong.
Let’s break this down. In this guide I’ll give you the exact conversion rate formula for micro conversions, a numbered worked example with real numbers, the session-vs-user decision that changes the whole story, how to measure it in GA4, and rough benchmark ranges by funnel stage. If you want to know which small actions to track in the first place, that’s a different question — I’ll point you to which micro-conversions actually predict revenue for that part.
What is a micro conversion rate?
A micro conversion rate is the percentage of visitors who complete a smaller, lower-commitment action on the way to your main goal. Think pricing-page views, email signups, video plays, “add to cart,” or scroll-to-bottom on a key article. These are micro conversions — useful signals of intent that happen long before someone becomes a customer.
Compare that with a macro conversion: the primary business outcome, like a purchase, a demo request, or a paid signup. The macro conversion rate is the headline metric everyone watches. But it’s a lagging one. A micro conversion rate is closer to the action, so it reacts faster and tells you where people are progressing — or stalling — inside the journey.
Both are still conversion events in your analytics tool. The only real difference is intent and commitment level. For a clean breakdown of what should count in the first place, see what counts as a conversion event. Once you’ve decided which actions qualify, calculating the rate is the easy part — as long as you pick the right denominator.
The micro conversion rate formula
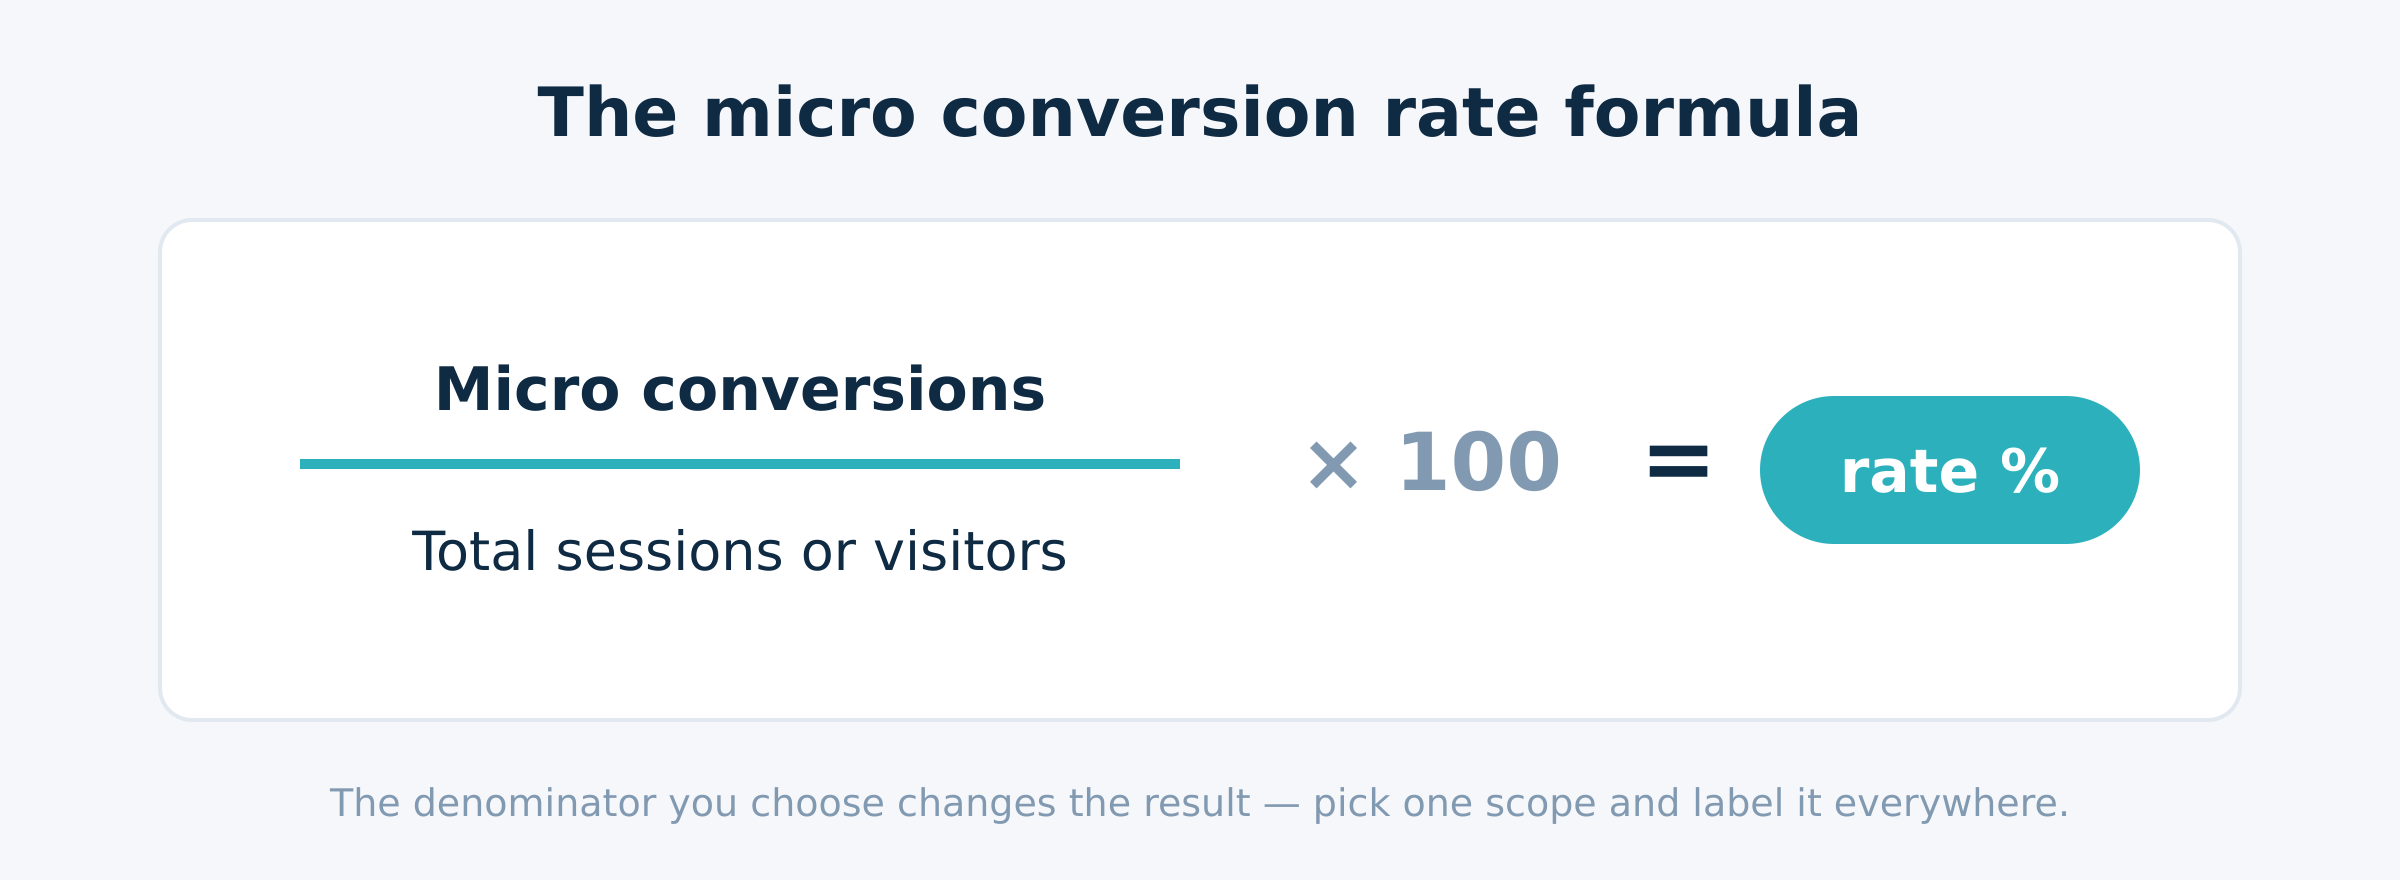
The conversion rate formula for any micro action is short:
Micro conversion rate = (micro conversions ÷ chosen denominator) × 100
Where the denominator is your total visitors, your sessions, or your unique users for the same period.
That’s it. Count the micro conversions, divide by how many people (or sessions) had the chance to do it, multiply by 100. The numerator is straightforward once your conversion events are firing cleanly — which is exactly why event hygiene matters. If your events double-fire or miss, the rate is wrong before you even start. Set up the measurement plumbing first; track these actions on your landing pages so the numerator is trustworthy.
The short answer is “just divide and multiply.” But here’s the nuance: the number you get depends entirely on what you divide by. That’s not a footnote. It’s the whole game.
Sessions, users, or pageviews — choosing your denominator
The denominator decides whether your rate means anything. Pick the wrong one and you’ll compare numbers that aren’t comparable. Here are your realistic options:
- Sessions — the denominator GA4 defaults to for many metrics. A session-scoped rate answers: “of all visits, how many included this action?” Good for behavior tied to a single visit, like a video play or a pricing-page view.
- Unique users — a user-scoped rate answers: “of all people, how many ever did this?” Better for actions that naturally span visits, like signing up after researching for a week.
- Total visitors — often used loosely to mean users, but be precise. “Visitors” usually maps to users in GA4. Decide which you mean and write it down.
- Pageviews — almost always the wrong denominator for a micro conversion rate. One person can rack up ten pageviews, so the rate gets diluted and stops reflecting people. Avoid it unless you’re measuring a per-page interaction rate on purpose.
The rule I give clients: match the denominator to the action’s natural unit. Single-visit action? Use sessions. Cross-visit decision? Use unique users. And whatever you choose, label it everywhere. A “15% rate” with no scope attached is a number nobody can act on.
A worked example (with real numbers)
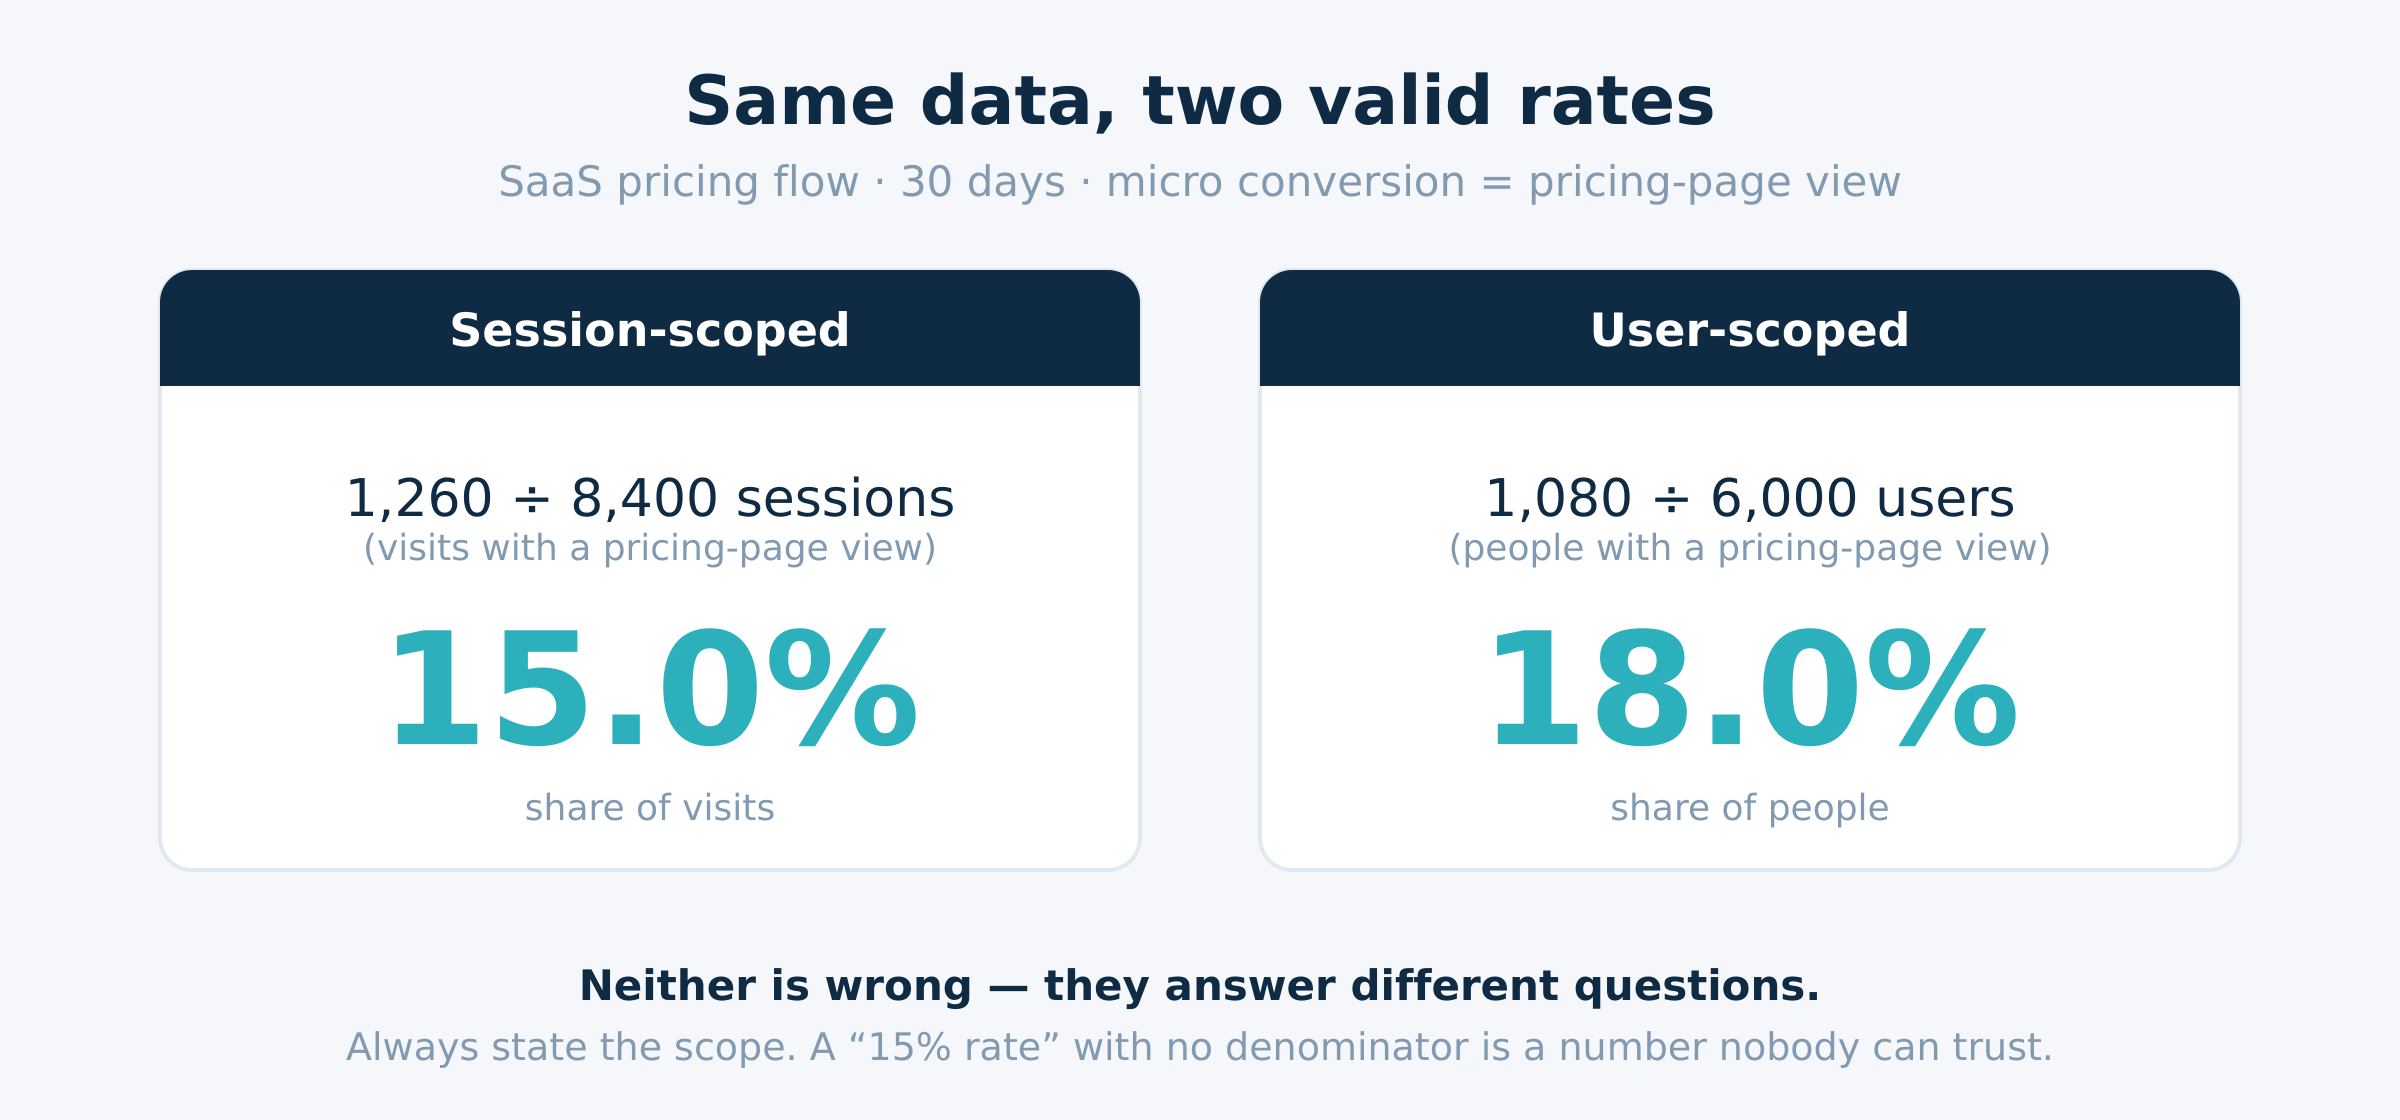
Theory is cheap. The fastest way to learn how to calculate a micro conversion rate is to run a real worked example and watch how the denominator changes the story from one dataset. Imagine a SaaS pricing flow over 30 days:
- 8,400 sessions landed on the site
- From 6,000 unique users
- 1,260 sessions included a pricing-page view (our micro conversion)
- Those came from 1,080 unique users
Now apply the conversion rate formula twice — once per scope:
- Session-scoped: (1,260 ÷ 8,400) × 100 = 15.0%. Fifteen percent of visits reached pricing.
- User-scoped: (1,080 ÷ 6,000) × 100 = 18.0%. Eighteen percent of people reached pricing.
Same micro conversion, same month, two different numbers: 15% versus 18%. Neither is wrong. They answer different questions. The user-scoped rate is higher because some people visited more than once without re-viewing pricing each time. If you report 18% to the team and your dashboard quietly tracks 15%, someone will eventually catch the mismatch — and trust in the whole report takes a hit. Dashboards are only as good as the events behind them, and the scopes behind those events.
This is why I always show both early in an engagement, then pick one as the official metric and stick to it. Consistency beats precision here. Pick a scope, document it, and never silently switch.
How to measure micro conversion rate in GA4
Now the practical part: how to measure micro conversion rate in GA4. Most people who ask how to calculate this metric are really asking where the numbers live in their analytics tool. The platform won’t hand you a “micro conversion rate” metric out of the box, but you can build it with two pieces — an event marked as a key event, and a quick division in a report. Let’s walk through it.
Setting up the micro-conversion as a key event
- Make sure the micro action fires as a clean event. Use a clear, consistent name like
view_pricingorsignup_start. Sloppy names break counts later, so lock in consistent GA4 event names first. - In GA4 Admin, open Events, find your event, and toggle Mark as key event. This tells GA4 to treat it as a counted outcome — it’s how GA4 records the conversion events you care about.
- Decide your scope now. GA4 reports a “key event rate” that is session-based by default in many reports. If you want a user-scoped rate, you’ll calculate it yourself from user counts.
Reading the rate in Explorations / funnel reports
To read the rate, you’ve got two clean routes:
- Explorations (free-form): drop in
Sessionsand your key event count, then add a calculated comparison or export to a sheet and divide. This gives you full control over the denominator. - Funnel exploration: build a funnel where the micro action is a step. GA4 shows the completion rate between steps, which is effectively a funnel stage micro conversion rate. This is my preferred view because it ties the rate to position in the journey.
One caution: GA4’s built-in rates are session-scoped unless you build user-scoped ones manually. So if you quote a GA4 number next to a user-scoped figure from another tool, you’re comparing apples to oranges. Confirm the scope before you trust the comparison. Google’s own GA4 key events documentation spells out how key events are counted if you want the source detail.
What’s a good micro conversion rate? (benchmarks by funnel stage)
Everyone wants a single “good” number. Honestly, there isn’t one — a micro conversion rate is funnel stage-specific, not one site-wide figure. A scroll-depth rate and a checkout-start rate live in different universes. That said, here’s a rough benchmark table from patterns I see across consulting projects. Treat it as a sanity check, not a target.
| Funnel stage | Example micro conversion | Typical rate (session-scoped) |
|---|---|---|
| Awareness (top) | Scroll-to-bottom, 30s+ engaged | 25–55% |
| Interest (upper-mid) | Pricing-page view, video play | 10–25% |
| Consideration (mid) | Add-to-cart, email signup | 3–12% |
| Intent (lower-mid) | Checkout start, demo form open | 2–8% |
| Decision (bottom, macro) | Purchase, paid signup | 1–4% |
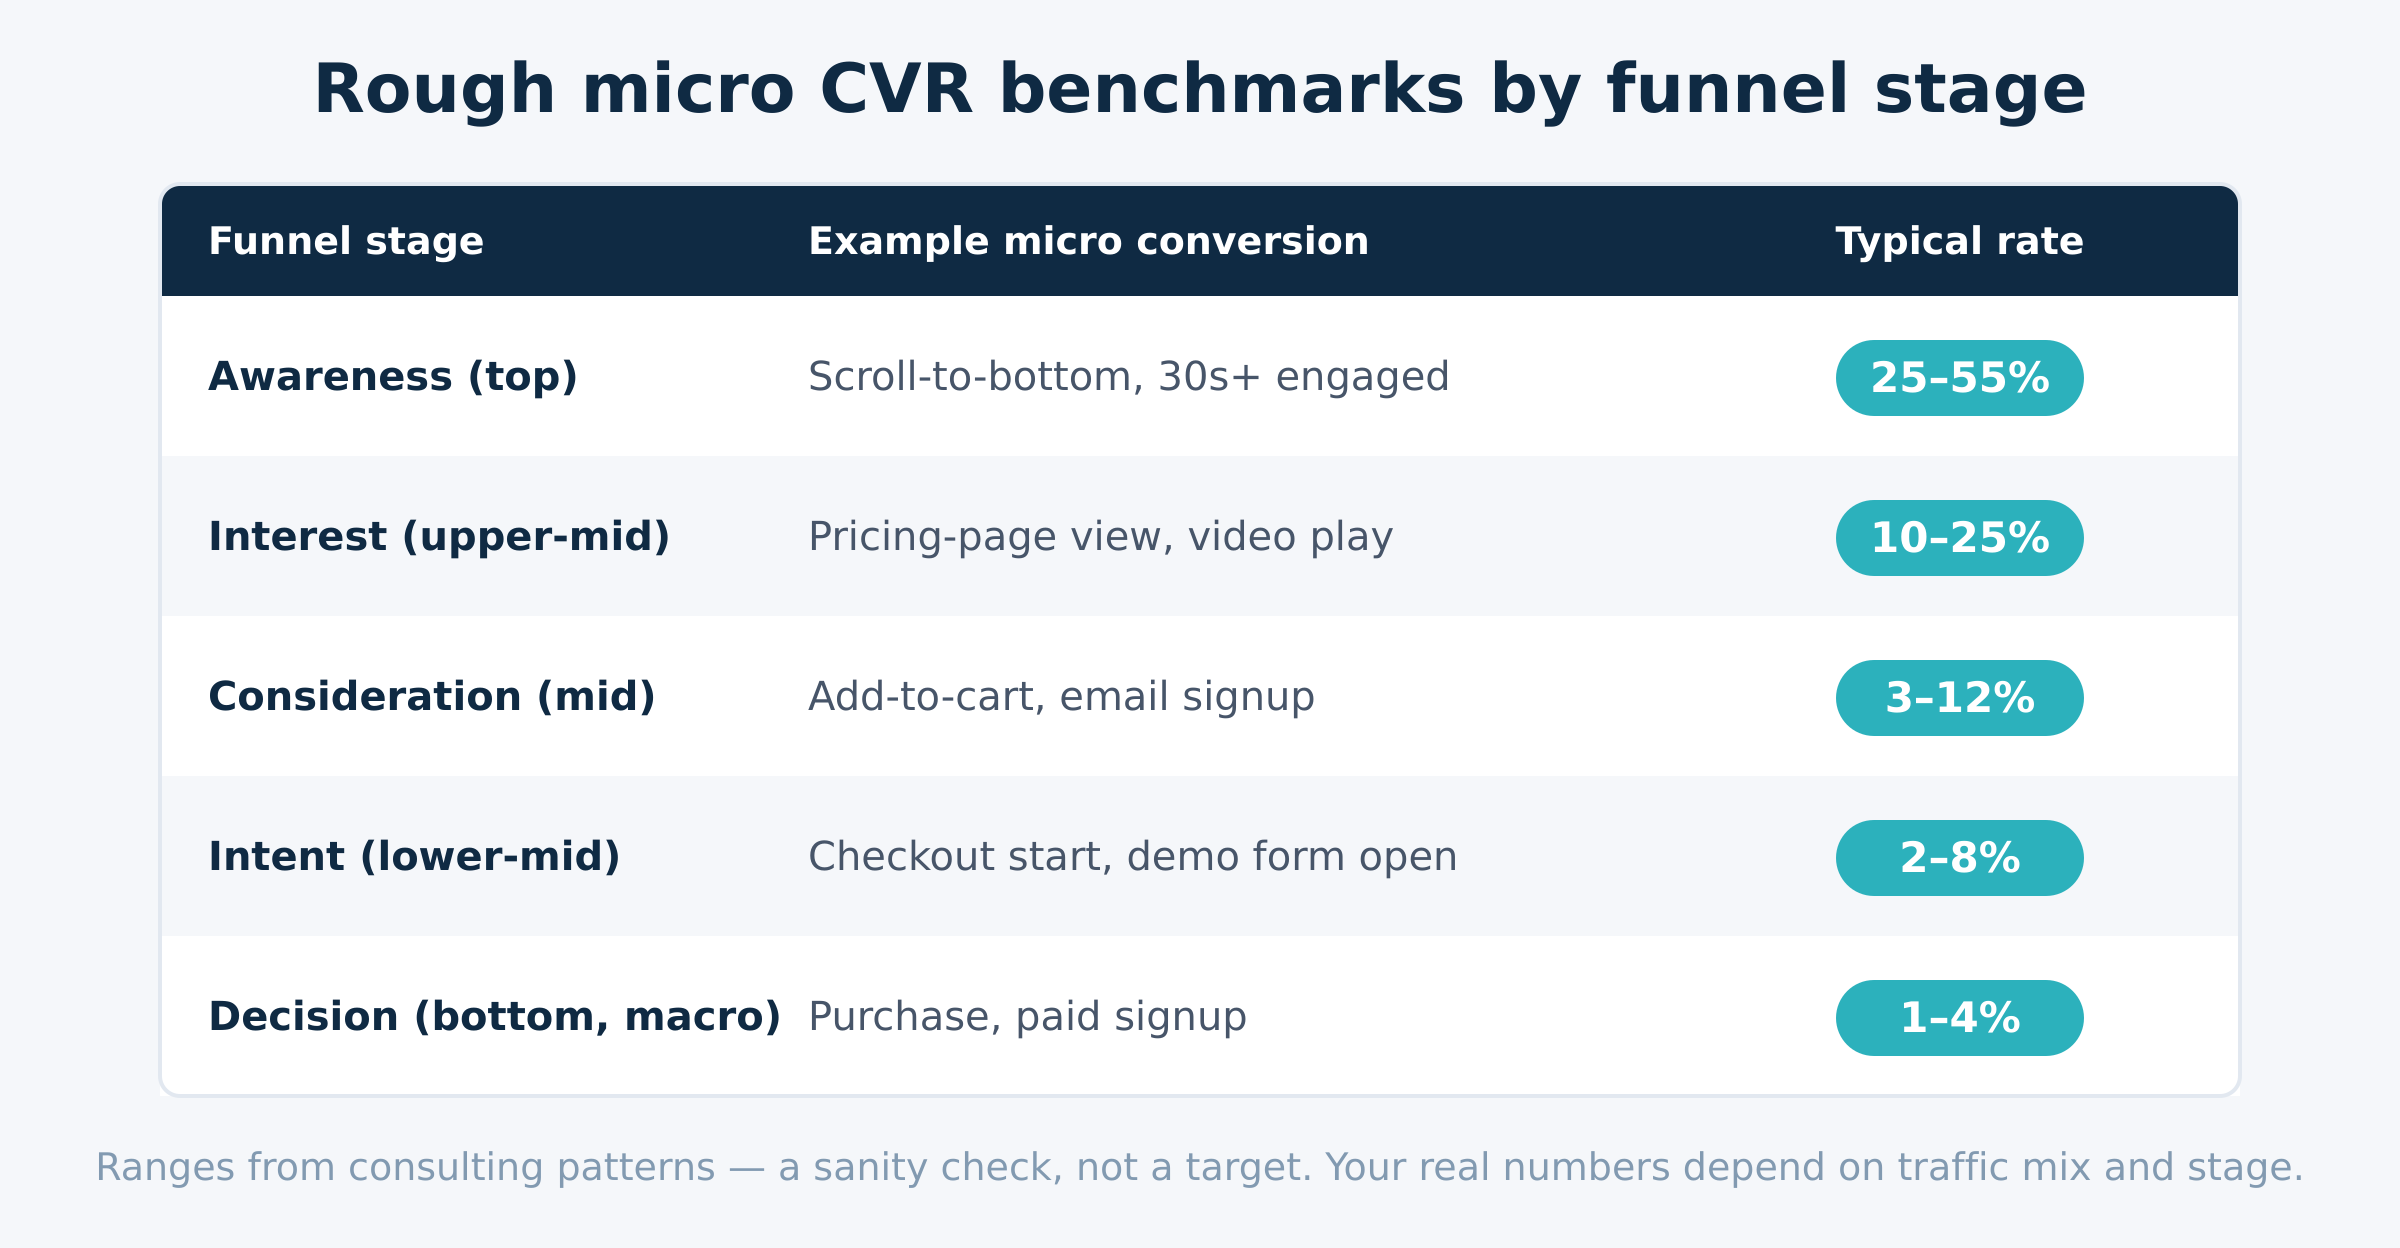
Notice the gradient: rates fall as commitment rises. That’s expected. A pricing-page view at the interest stage might be healthy at 15%, while a checkout start at 3% might be perfectly normal for the same site. Comparing them directly would be a mistake. Always read each rate against its own funnel stage, and weigh it against your historical baseline before you call it good or bad. Your trend over time beats any external benchmark.
Common mistakes when calculating micro conversion rate
Knowing how to calculate the rate is only half the job. I’ve audited enough broken setups to see the same errors on repeat. Watch for these:
- Denominator mismatch. Counting the numerator from users but dividing by sessions (or vice versa). This is the number-one mistake. Keep numerator and denominator in the same scope, every time.
- Mixing scopes across reports. A session-scoped rate in one dashboard, a user-scoped rate in another, both labeled “micro conversion rate.” Nobody can reconcile them. Standardize one scope portfolio-wide.
- Averaging across funnel stages. Blending a 40% scroll rate with a 3% checkout rate into one “average micro conversion rate” produces a meaningless number. Keep rates funnel stage-specific.
- Counting dirty events. Double-firing or duplicate conversion events inflate the numerator. Validate your events before you trust the rate.
- Using pageviews as the denominator. It dilutes the rate and stops measuring people. Use total visitors (users) or sessions instead.
Fix these and your micro conversion rate becomes something you can actually defend in a meeting. Skip them, and you’re reporting noise with a confident face.
From rate to revenue: making the number actionable
A rate on its own is just a percentage. The point is to make it predictive — to connect the small action to the money. Here’s the simple bridge: estimate the revenue value of one micro conversion (its historical contribution to an eventual macro conversion), then multiply by volume. A lift in the rate, times your traffic, times that per-action value, gives you a real revenue estimate.
For example, if raising a pricing-page-view rate from 15% to 18% adds 250 extra views a month, and each view is historically worth €4 in downstream revenue, that’s roughly €1,000/month — from one micro conversion rate moving three points. That’s how a predictive micro conversion rate justifies optimization work to a CFO.
Two things make this credible. First, you need to know which actions genuinely lead to revenue — that’s the strategy layer, covered in which micro-conversions actually predict revenue. Second, you need to assign value correctly across touchpoints, which is an attribution model question. Once you’ve calculated the rate cleanly, plug it into your conversion rate optimization framework and start testing the steps that move it. That’s where a measured rate turns into compounding gains.
Frequently Asked Questions
What is the formula for micro conversion rate?
The formula is: micro conversion rate = (micro conversions ÷ chosen denominator) × 100. The numerator is the count of your micro action — a pricing-page view, signup start, or video play. The denominator is either sessions or unique users for the same period. The key decision is the scope. A session-scoped rate answers “what share of visits included this action?” while a user-scoped rate answers “what share of people ever did it?” Both use the same conversion rate formula; they just divide by different totals. For a single visit-bound action like a video play, sessions usually fit best. For a decision that spans several visits, unique users is the cleaner choice. Whichever you pick, label it on every chart so nobody confuses the two.
How do you calculate micro conversion rate in GA4?
In GA4, first mark your micro action as a key event under Admin → Events. That makes GA4 count it as one of your tracked conversion events. Then build the rate in a report: use an Exploration to pull your key event count and your sessions (or user) count, and divide. GA4’s built-in “key event rate” is session-scoped in most reports, so if you need a user-scoped figure you calculate it yourself from user totals. My preferred method is a funnel exploration, where the micro action is a step and GA4 shows the step-completion rate directly — that gives you a funnel stage micro conversion rate without manual math. Just confirm the scope before comparing it to numbers from any other tool.
What’s the difference between micro and macro conversion rate?
Both use the same conversion rate formula — they differ in what they measure. A macro conversion rate tracks your primary outcome: purchases, paid signups, demo requests. A micro conversion rate tracks smaller, intent-signaling steps that come earlier, like pricing views or email signups. Because micro conversions sit closer to the visitor’s first actions, their rates are higher and they move faster, so they’re better early-warning signals. The macro rate is the lagging headline; the micro rate is the leading indicator. You want both. The macro rate tells you if the business is converting; the micro rates tell you where in the journey people progress or stall, so you know which step to fix.
What is a good micro conversion rate?
It depends on the funnel stage — there’s no single good number. As a rough benchmark (session-scoped): top-of-funnel actions like scroll-depth often run 25–55%; interest-stage actions like a pricing-page view land around 10–25%; mid-funnel actions like add-to-cart or email signup sit near 3–12%; and intent-stage actions like checkout start fall to 2–8%. Rates drop as commitment rises, which is normal. The biggest mistake is comparing a top-funnel rate against a bottom-funnel one. Read each rate against its own stage and, more importantly, against your own historical trend. A rate that’s climbing month over month beats any external benchmark, because it reflects real improvement on your specific audience.
Should you divide by sessions, users, or pageviews?
Match the denominator to the action’s natural unit. Use sessions for single-visit behavior like a video play or pricing-page view — you’re asking what share of visits included it. Use unique users for decisions that span multiple visits, like signing up after a week of research. Avoid pageviews almost always: one person can generate many pageviews, which dilutes the rate and stops it from reflecting people. “Total visitors” usually maps to users in GA4, so just be precise about which you mean. The non-negotiable rule is consistency — keep your numerator and denominator in the same scope, and use the same denominator across every report so your numbers stay comparable.
How do you use micro conversion rate to predict revenue?
Turn the rate into a predictive revenue estimate by assigning each micro conversion a value — its historical contribution to an eventual macro conversion — then multiplying by volume. If lifting a rate by three points adds 250 micro conversions a month and each is worth €4 downstream, that’s about €1,000/month from one rate change. Two things keep this honest: knowing which small actions genuinely lead to revenue (the strategy side, not the calculation), and attributing value fairly across touchpoints with a sound attribution model. The rate calculation gets you the clean number; pairing it with value and volume turns that number into a forecast you can take to a budget conversation.
Key Takeaways
- The micro conversion rate formula is simple: (micro conversions ÷ denominator) × 100. The math is never the hard part.
- The denominator decides everything. Use sessions for single-visit actions, unique users for cross-visit decisions, and avoid pageviews.
- The same data gave us 15% session-scoped and 18% user-scoped in our worked example — pick one scope and label it everywhere.
- Measure it in GA4 by marking the action as a key event, then dividing in an Exploration or reading a funnel step’s completion rate.
- There’s no universal good number — a healthy rate is funnel stage-specific, so read each benchmark against its own stage and your own trend.
- Make it predictive by multiplying rate lift × volume × per-action value to estimate revenue impact.